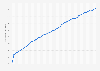
This statistic shows the debt ratio as percentage over disposable income in Belgium, Luxembourg, and the Netherlands from 2016 to 2020. In 2020, the ratio reached a percentage of approximately 189.5 percent in the Netherlands, and 106.1 percent in Belgium.
Debt ratio as percentage over disposable income in Belgium, Luxembourg and the Netherlands from 2016 to 2020
The source indicates that "unless otherwise indicated, all data presented in this report are compiled according to the European System of Accounts (ESA) 2010". Also, the numbers used include net capital transfers. The number provided by the source, is the sum of the fourth quarter in the corresponding year.
No number was provided for Luxembourg in 2019 and 2020.
Profit from the additional features of your individual account
Currently, you are using a shared account. To use individual functions (e.g., mark statistics as favourites, set
statistic alerts) please log in with your personal account.
If you are an admin, please authenticate by logging in again.
Learn more about how Statista can support your business.
ECB. (September 9, 2021). Debt ratio as percentage over disposable income in Belgium, Luxembourg and the Netherlands from 2016 to 2020 [Graph]. In Statista. Retrieved November 09, 2024, from https://www.statista.com/statistics/735151/debt-ratio-in-belgium-and-the-netherlands/
ECB. "Debt ratio as percentage over disposable income in Belgium, Luxembourg and the Netherlands from 2016 to 2020." Chart. September 9, 2021. Statista. Accessed November 09, 2024. https://www.statista.com/statistics/735151/debt-ratio-in-belgium-and-the-netherlands/
ECB. (2021). Debt ratio as percentage over disposable income in Belgium, Luxembourg and the Netherlands from 2016 to 2020. Statista. Statista Inc.. Accessed: November 09, 2024. https://www.statista.com/statistics/735151/debt-ratio-in-belgium-and-the-netherlands/
ECB. "Debt Ratio as Percentage over Disposable Income in Belgium, Luxembourg and The Netherlands from 2016 to 2020." Statista, Statista Inc., 9 Sep 2021, https://www.statista.com/statistics/735151/debt-ratio-in-belgium-and-the-netherlands/
ECB, Debt ratio as percentage over disposable income in Belgium, Luxembourg and the Netherlands from 2016 to 2020 Statista, https://www.statista.com/statistics/735151/debt-ratio-in-belgium-and-the-netherlands/ (last visited November 09, 2024)
Debt ratio as percentage over disposable income in Belgium, Luxembourg and the Netherlands from 2016 to 2020 [Graph], ECB, September 9, 2021. [Online]. Available: https://www.statista.com/statistics/735151/debt-ratio-in-belgium-and-the-netherlands/