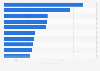
This statistic shows the average number of days for songs to reach one billion view on YouTube from 2010 to 2017, sorted by year of release. Billion-views music videos released in 2017 only took 171 days to do so, while billion-views music videos released on 2011 took an average of 1,751 days.
Average number of days for songs to reach one billion view on YouTube from 2010 to 2017, by year of release
Loading statistic...
Basic Account
Get to know the platform
You only have access to basic statistics.
Starter Account
The ideal entry-level account for individual users
- Instant access to 1m statistics
- Download in XLS, PDF & PNG format
- Detailed references
$149 USD / Month *
Professional Account
Full access
Business Solutions including all features.
* Prices do not include sales tax.
Other statistics that may interest you Statistics on
About the industry
10
- Premium Statistic Most popular educational institutions on YouTube in Finland 2020, by video views
- Basic Statistic Most popular YouTube content categories 2018, by uploads
- Basic Statistic Most popular YouTube content categories 2018, by views
- Premium Statistic Italy: YouTube videos optimal length 2018
- Premium Statistic Most popular YouTube channels among teenagers in Germany 2022
- Basic Statistic U.S. registered YouTube user reach 2022, by household income
- Premium Statistic Most popular bands on YouTube in Finland 2021, by number of subscribers
- Premium Statistic Most popular YouTube channels in Finland 2020, by number of subscribers
- Premium Statistic Mexico: popular video streaming services 2020
- Premium Statistic Leading radio channels on YouTube in Italy 2020
About the region
10
- Basic Statistic Average YouTube video length 2018, by category
- Premium Statistic Global YouTube celebrity or vlogger viewership 2016, by age group
- Premium Statistic Leading global YouTube activities 2016
- Premium Statistic YouTube usage reach worldwide 2013-2015
- Premium Statistic Quarterly Netflix subscribers count worldwide 2013-2023
- Premium Statistic Netflix's quarterly net income 2013-2023
- Premium Statistic Paid net subscriber additions of Netflix worldwide 2014-2023
- Basic Statistic Share of videos removed from YouTube worldwide Q4 2022, by reason
- Premium Statistic Netflix's annual revenue 2002-2022
- Basic Statistic Netflix: net income 2000-2022
Other regions
10
- Premium Statistic Leading YouTube channels in Poland 2023, by subscribers
- Basic Statistic YouTube usage frequency in the United States 2020
- Basic Statistic Canada categories of YouTube videos watched by mothers 2016
- Basic Statistic Popular YouTube channels South Korea 2022, by views
- Premium Statistic Estonia: online video sources 2015
- Premium Statistic Switzerland: online video sources 2015
- Premium Statistic Croatia: online video sources 2015
- Premium Statistic Taiwan: online video sources 2015
- Premium Statistic Malaysia: online video sources 2015
- Premium Statistic Turkey: online video sources 2015
Related statistics
10
- Basic Statistic YouTube usage reach in the United States 2018, by urbanity
- Basic Statistic Mobile YouTube usage frequency in the United States 2017
- Premium Statistic U.S. YouTube mobile usage reach 2015, by device
- Premium Statistic YouTube: share of social network website visits in the United Kingdom (UK) 2018-2023
- Basic Statistic Most popular French YouTube channels as of 2023, by number of subscribers
- Premium Statistic YouTube monthly web visit share in Italy 2018-2023
- Premium Statistic YouTube: most popular brand channels 2021, by total number of video views
- Premium Statistic Most popular FMCG brands on YouTube in Finland 2021, by number of video views
- Premium Statistic Most popular electronics brands on YouTube in Finland 2021, by number of video views
- Premium Statistic Most popular retailers on YouTube in Finland 2021, by number of video views
Further related statistics
1
Further Content: You might find this interesting as well
Music Industry Blog, & MIDiA Research. (August 28, 2018). Average number of days for songs to reach one billion view on YouTube from 2010 to 2017, by year of release [Graph]. In Statista. Retrieved December 06, 2023, from https://www.statista.com/statistics/811563/youtube-average-time-for-1-billion-music-video-views/
Music Industry Blog, und MIDiA Research. "Average number of days for songs to reach one billion view on YouTube from 2010 to 2017, by year of release." Chart. August 28, 2018. Statista. Accessed December 06, 2023. https://www.statista.com/statistics/811563/youtube-average-time-for-1-billion-music-video-views/
Music Industry Blog, MIDiA Research. (2018). Average number of days for songs to reach one billion view on YouTube from 2010 to 2017, by year of release. Statista. Statista Inc.. Accessed: December 06, 2023. https://www.statista.com/statistics/811563/youtube-average-time-for-1-billion-music-video-views/
Music Industry Blog, and MIDiA Research. "Average Number of Days for Songs to Reach One Billion View on Youtube from 2010 to 2017, by Year of Release." Statista, Statista Inc., 28 Aug 2018, https://www.statista.com/statistics/811563/youtube-average-time-for-1-billion-music-video-views/
Music Industry Blog & MIDiA Research, Average number of days for songs to reach one billion view on YouTube from 2010 to 2017, by year of release Statista, https://www.statista.com/statistics/811563/youtube-average-time-for-1-billion-music-video-views/ (last visited December 06, 2023)
Average number of days for songs to reach one billion view on YouTube from 2010 to 2017, by year of release [Graph], Music Industry Blog, & MIDiA Research, August 28, 2018. [Online]. Available: https://www.statista.com/statistics/811563/youtube-average-time-for-1-billion-music-video-views/