Skip to main content
Consumer Goods & FMCG
E-Commerce
Economy & Politics
Energy & Environment
Health, Pharma & Medtech
Internet
Media
Technology & Telecommunications
Transportation & Logistics
Travel, Tourism & Hospitality
View all industries
Global data volume growth
Global AI market size
Number of generative AI users worldwide
Global inflation rate
Retail e-commerce sales worldwide
Largest economies worldwide
Biggest social media platforms by users
Global EV market share by manufacturer
International tourist arrivals by world region
Global annual CO₂ emissions
Browse recent statistics
Artificial intelligence (AI) worldwide
TikTok
Nvidia
E-commerce worldwide
Global GDP
Instagram
Apparel market worldwide
Video gaming worldwide
Global renewable energy industry
Influencer marketing worldwide
Browse recent topics
Consumer Trends 2026
Artificial Intelligence: in-depth market analysis
E-commerce challenges
Global economy
TikTok
Luxury goods: in-depth market analysis
Electric vehicles: A global overview
Video gaming worldwide
Travel and tourism trends 2026
Battery recycling worldwide
Browse recent reports
Explore the tool
Explore Classic mode
Advertising & Media
eCommerce
Consumer
Finance
Global Indicators
Health
Industrial
Mobility
Technology
Explore Market Insights
eCommerce Insights
Research AI
Book a demo
All integrations
Developer docs
Explore Statista Connect
Research
Strategy & Consulting
Marketing
Media & PR
Explore AI assistants
Marketing
Research & Development
Strategy
Sales
Find the fact
Tell the story
Win the pitch
Understand the market
Develop your strategy
Academia
Agencies
Consultancies
Consumer goods
Finance
Tech
Research solutions
Strategy consulting
Communication services
Explore Statista+
Statista R
Statista Healthcare
About Statista
First steps & help center
Webinar & training hub
Success stories
Individuals & Small Teams
Businesses & Enterprises
Academia & Government
English
Deutsch
Daily Data
Infographics on the topic "smartphones"
Productivity
Jun 5, 2020
This chart shows the global weekly smartphone downloads of business apps (in millions).
More Information
Consumer Electronics
May 15, 2020
This chart shows the quarterly domestic shipping volumes of Chinese smartphone manufacturers.
More Information
Smartphone Market
May 13, 2020
This chart shows worldwide quarterly smartphone shipments.
More Information
Electronics
Apr 28, 2020
This chart shows an updated forecast for U.S. consumer electronics sales in 2020 and relative year-to-year difference.
More Information
Traffic Fatalities
Mar 4, 2020
This chart shows the number of pedestrians killed in large U.S. cities in 2018.
More Information
United Kingdom
Feb 24, 2020
This chart shows the number of smartphones, laptops and tablets stolen/lost by government department (June 2018-June 2019)
More Information
Digital Photography
Feb 7, 2020
This chart shows how many digital cameras the world's largest camera vendors shipped between 2003 and 2016.
More Information
Apps
Jan 14, 2020
This chart shows annual revenue generated by KakaoTalk Gift (in billion Won).
More Information
Smartphones
Jan 3, 2020
This chart shows the smartphones with the longest-lasting batteries on the market.
More Information
End of the Decade
Jan 2, 2020
This chart shows selected technology sector projections for the next decade as of December 2019.
More Information
Smartphone Economy
Dec 10, 2019
This chart shows estimated sales of smartphones and related hardware, content and services in 2020.
More Information
Smartphone Market
Dec 10, 2019
This chart shows estimated global smartphone shipments since 2008 and a forecast until 2023.
More Information
Media Consumption
Nov 29, 2019
This chart breaks down digital media consumption in the United States by platform.
More Information
Christmas Gifts
Nov 29, 2019
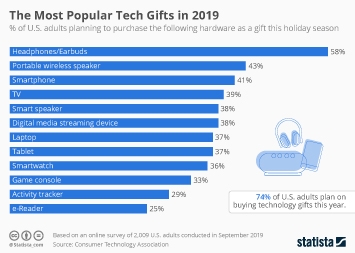
This chart shows the percentage of U.S. adults planning to buy tech items as Christmas gifts this year.
More Information
Reading Habits in the United States
Nov 18, 2019
This chart shows the percentage of American adults who read books.
More Information
Ad Spend
Oct 28, 2019
This chart shows global/mobile ad spending distribution by platform.
More Information
News consumption
Sep 26, 2019
This chart shows how different age groups have different preferences regarding their main source of news.
More Information
Consumer Behavior
Sep 12, 2019
This chart shows actions taken by digital buyers when using a retailer's mobile app while in-store.
More Information
Tech
Sep 11, 2019
This chart shows the contribution of the mobile industry to global GDP in 2018, by region.
More Information
iPhone
Sep 10, 2019
This chart shows smartphone models by 4G download speed experienced in the U.S. in 2019 (Mbps).
More Information
iPhone
Sep 10, 2019
This chart shows average 4G download speeds experienced by iPhone models in the U.S. (Mbps)
More Information
News Apps
Sep 9, 2019
This chart shows the percent of phones select apps were found on.
More Information
Travel Tech
Sep 4, 2019
This chart shows the share of respondents who feel the following benefit them when booking online/via apps.
More Information
Smartphone Market
Aug 28, 2019
This chart shows the top 5 smartphone vendors based on worldwide unit sales to end users.
More Information
Travel Industry
Aug 16, 2019
This chart shows the percent of U.S. respondents who think each device is the most important for the following travel-related activities.
More Information
Smartphones
Aug 8, 2019
This chart shows the average download speed by handset maker in selected countries (Mbps).
More Information
iPhone Loyalty
Jul 23, 2019
This chart shows the share of iPhone users planning to stick with Apple for their next smartphone purchase.
More Information
Media Usage
Jul 12, 2019
This chart shows reported media service usage in the United States in 2019.
More Information
Photography Timeline
Jun 24, 2019
This chart shows the timeline of the camera from the early 1500's to present day.
More Information
App Usage
Jun 21, 2019
This chart shows the smartphone app usage by application type in the U.S. 2019.
More Information
Digital Cameras
Jun 21, 2019
This chart shows the percent of generation Z respondents that own or use a digital camera.
More Information
Internet Users
Jun 20, 2019
This chart shows the share of respondents who do not have high speed internet at home, by reason.
More Information
Personal Information
Jun 19, 2019
This chart shows the median price U.S. adults would charge a company for personal information.
More Information
Selfies
Jun 17, 2019
This chart shows the percent who think it is acceptable or unacceptable to take a selfie in certain circumstances.
More Information
Smartphone News Use
Jun 14, 2019
This chart shows the proportion of smartphone-first users that used each for first contact with news.
More Information
Digital Media Use
Jun 12, 2019
This chart shows the daily hours spent with digital media in the U.S. per adult user, 2008 to 2018.
More Information
Digital Divide
Jun 5, 2019
This chart shows the percent of U.S. adults with access to home broadband and devices by area.
More Information
Smartphone usage
May 31, 2019
This chart shows when Americans first use their smartphones after waking up and when they last use it before going to sleep.
More Information
Portable Audio Market
May 29, 2019
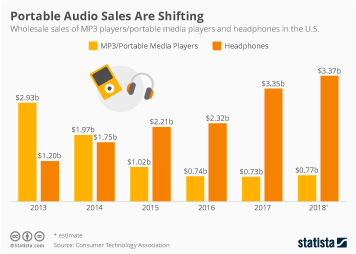
This chart shows wholesale sales of MP3 players/portable media players and headphones in the U.S.
More Information
Dating
May 23, 2019
This chart shows the share of U.S. men/women who would find the following irritating on a first date.
More Information
Huawei Ban
May 22, 2019
Share of respondents whose main smartphone was manufactured by Huawei in 2019.
More Information
Huawei
May 20, 2019
This chart shows the worldwide smartphone market share of Huawei.
More Information
Internet Advertising
May 10, 2019
This chart shows the desktop and mobile internet worldwide advertising revenue in billions of U.S. dollars.
More Information
Internet Usage
May 3, 2019
This chart shows the share who say they don't use the internet but report using Facebook & WhatsApp.
More Information
ePublishing
Apr 16, 2019
This chart shows the revenue forecast and growth rate (in billion USD) for ePublishing in selected countries.
More Information
Smartphone Industry
Mar 4, 2019
The chart shows which features would get smartphone users in the U.S. excited about buying a new model.
More Information
Smartphone Prices
Feb 28, 2019
This chart shows what U.S. smartphone users are willing to spend on a new device.
More Information
E-Waste
Feb 28, 2019
This chart shows e-waste generated per inhabitant in selected countries in 2016 (kg).
More Information
Smartphone Adoption
Feb 25, 2019
This chart shows global smartphone adoption by region.
More Information
Smartphone Market
Feb 20, 2019
This chart shows worldwide smartphone shipments of the leading vendors in 2018.
More Information
Samsung vs. Apple
Feb 20, 2019
This chart compares Samsung and Apple in terms of mobile device revenue.
More Information
Smartphone Sales
Feb 19, 2019
This chart shows the market share of Chinese manufacturers in smartphone sales in Europe.
More Information
Tech
Feb 19, 2019
This chart shows the results of a survey on the most wanted features of a smartphone.
More Information
Smartphone Ownership
Feb 8, 2019
This chart shows the share of adults who own no mobile phone or have a non-smartphone in 2018.
More Information
Computer Ownership
Feb 6, 2019
This chart shows the percent of device ownership among U.S. teens by family income.
More Information
Second-Screen Usage
Jan 22, 2019
This chart shows how often Americans use digital devices while watching TV.
More Information
Media Use
Jan 16, 2019
This chart illustrates how much time American adults spend using electronic media per day.
More Information
Internet
Nov 28, 2018
This chart shows the countries where the difference between wi-fi and mobile d/l speeds is largest in 2018.
More Information
Tablet Market
Nov 13, 2018
This chart shows the long-term growth of the global tablet market.
More Information
Cyberbullying
Oct 30, 2018
This chart shows the share of parents who say their child has experienced cyberbullying.
More Information
Japan
Oct 24, 2018
This chart shows the share of the Japanese wearables market in 2017 by company.
More Information
Tech
Oct 19, 2018
This chart shows how frequently people in the UK use their smartphones during certain situations in 2018.
More Information
Australia
Oct 10, 2018
This chart shows the market share of leading mobile vendors in Australia in 2018.
More Information
Technology
Oct 8, 2018
This chart shows the smartphones with the highest market share in selected countries in July 2018.
More Information
Smartphone Brands
Oct 3, 2018
This chart shows the share of main smartphone brands by country.
More Information
Fashion Industry
Sep 25, 2018
This chart shows the share of jeans that can fit the average hand size, broken down by gender.
More Information
Android
Sep 24, 2018
This chart shows worldwide smartphone sales by operating system since 2009.
More Information
Teens and Tech
Sep 13, 2018
This chart shows the change in social media habits of 13-17 year old teenagers in the U.S. between 2012 and 2018.
More Information
iPhone Unveiling
Sep 11, 2018
This chart shows the most wanted features in Apple's new iPhones to be announced on Sept. 12, 2018
More Information
Data Collection
Aug 24, 2018
This chart shows how often Android phones and iPhones send information to Google and Apple servers.
More Information
China
Aug 24, 2018
This chart shows the number of internet users in China (millions).
More Information
Smartphone addiction
Aug 23, 2018
This chart shows how many teenagers in the U.S. think they spend too much time using their cell phone, on social media or playing video...
More Information
Asia
Aug 16, 2018
This chart shows 4G download speeds in major cities in East Asia as of 2017 (in megabits per second).
More Information
Device Penetration
Aug 13, 2018
This chart shows household penetration of the following tech products in the United States.
More Information
5G
Aug 13, 2018
This chart shows the estimated number of 5G mobile connections (millions)
More Information
Digital Devices
Aug 6, 2018
This chart shows the share of adults (16+) owning one of the following in 2008 and 2018.
More Information
Battle Royale
Jul 20, 2018
This chart shows estimated global revenue of battle royale games from 2017 to 2019.
More Information
Smart Speakers
Jul 20, 2018
This chart shows which devices U.S. smart speaker owners use less since having a voice-enabled speaker.
More Information
Tech
Jul 18, 2018
This chart shows the number of mobile phone manufacturing units in India from 2014 to 2018.
More Information
App Stores
Jul 6, 2018
This chart shows the share of global app downloads and consumer spend by app store.
More Information
Voice Assistants
Jun 29, 2018
The chart shows the market share of voice assistants in the U.S.
More Information
China
Jun 26, 2018
This chart shows the share of shipments made by smartphone vendors in China in Q1 2018.
More Information
Mobile Video
Jun 21, 2018
This chart breaks down global smartphone video consumption by the form of content.
More Information
Digital Detox
Jun 20, 2018
This chart shows how often Americans use their smartphones and how they try to limit their usage.
More Information
Smartphone Addiction
Jun 20, 2018
This chart shows wAmericans' view on who is responsible for solving smartphone addiction issues
More Information
FIFA World Cup Russia 2018
Jun 13, 2018
This chart shows which on which devices people aware of the 2018 FIFA World Cup plan to watch the event.
More Information
North Korea
Jun 11, 2018
This chart shows the approximate year media devices became commonly available in the U.S. & North Korea.
More Information
Smartphone Market
Jun 11, 2018
This chart shows estimated global shipments of the world's most popular smartphone models in Q1 2018.
More Information
Australia
Jun 5, 2018
This chart shows the products with which Australian adults pay the most attention to brands.
More Information
India
Jun 5, 2018
This chart shows the most common associations people in India have with Internet of Things in 2017.
More Information
4
/
8
Contact
Get in touch with us. We are happy to help.
Do you still have questions?
Feel free to contact us anytime using our
contact form
or visit our
FAQ page
.
Your contact to the Infographics Newsroom
Felix Richter
Data Journalist
felix.richter@statista.com
+49 (40) 284 841 557