Skip to main content
Consumer Goods & FMCG
E-Commerce
Economy & Politics
Energy & Environment
Health, Pharma & Medtech
Internet
Media
Technology & Telecommunications
Transportation & Logistics
Travel, Tourism & Hospitality
View all industries
Global data volume growth
Global AI market size
Number of generative AI users worldwide
Global inflation rate
Retail e-commerce sales worldwide
Largest economies worldwide
Biggest social media platforms by users
Global EV market share by manufacturer
International tourist arrivals by world region
Global annual CO₂ emissions
Browse recent statistics
Artificial intelligence (AI) worldwide
TikTok
Nvidia
E-commerce worldwide
Global GDP
Instagram
Apparel market worldwide
Video gaming worldwide
Global renewable energy industry
Influencer marketing worldwide
Browse recent topics
Consumer Trends 2026
Artificial Intelligence: in-depth market analysis
E-commerce challenges
Global economy
TikTok
Luxury goods: in-depth market analysis
Electric vehicles: A global overview
Video gaming worldwide
Travel and tourism trends 2026
Battery recycling worldwide
Browse recent reports
Explore the tool
Explore Classic mode
Advertising & Media
eCommerce
Consumer
Finance
Global Indicators
Health
Industrial
Mobility
Technology
Explore Market Insights
eCommerce Insights
Research AI
Book a demo
All integrations
Developer docs
Explore Statista Connect
Research
Strategy & Consulting
Marketing
Media & PR
Explore AI assistants
Marketing
Research & Development
Strategy
Sales
Find the fact
Tell the story
Win the pitch
Understand the market
Develop your strategy
Academia
Agencies
Consultancies
Consumer goods
Finance
Tech
Research solutions
Strategy consulting
Communication services
Explore Statista+
Statista R
Statista Healthcare
About Statista
First steps & help center
Webinar & training hub
Success stories
Individuals & Small Teams
Businesses & Enterprises
Academia & Government
English
Deutsch
Daily Data
Infographics on the topic "smartphones"
iPhone X
Jun 5, 2018
This chart shows the average number of working days required to buy an iPhone X in selected cities.
More Information
Apple vs. Samsung
May 25, 2018
This chart puts the $539 million that Apple was awarded in damages for patent infringement from Samsung in perspective.
More Information
Japan
May 23, 2018
This chart shows affiliate marketing spending in Japan in fiscal years 2013-2021.
More Information
Mobile Payment
May 23, 2018
This chart shows the estimated number of people using selected mobile payment services in the United States this year.
More Information
Japan
May 16, 2018
This chart shows the sales share of major smartphones in Japan in 2017, by smartphone model.
More Information
Zenith publishes global advertising forecast
May 15, 2018
This chart shows the estimated change in annual ad spending between 2017 and 2020.
More Information
India
May 8, 2018
This chart shows the market share of top smartphone companies in India in 2017, by vendor.
More Information
Video Games
May 8, 2018
This chart shows a forecast of global video game software revenue.
More Information
Chinese Smartphone Market
May 3, 2018
This chart shows the most successful smartphone vendors in China based on unit shipments in Q1 2018.
More Information
Internet Penetration
May 2, 2018
This chart illustrates global internet penetration in 2017, broken down by region.
More Information
Smart assistants
Apr 25, 2018
This chart shows how well digital voice assistants can answer basic questions.
More Information
E-Commerce
Apr 19, 2018
This chart ranks online retailers in the United States by the amount of time consumers spent on their respective websites/apps in December...
More Information
Technology Adoption Among Older Americans
Mar 12, 2018
This chart shows device ownership among Americans aged 50+ in 2017, by age group.
More Information
Smartphone Addiction
Feb 26, 2018
This chart shows who U.S. parents think is primarily responsible for limiting children's use of smartphones and other mobile devices.
More Information
Statista Global Consumer Survey
Feb 26, 2018
This chart shows the products with which U.S. adults pay the most attention to brands in 2018.
More Information
Mobile World Congress
Feb 23, 2018
This chart sums up a couple of interesting facts about the mobile phone industry.
More Information
Mobile World Congress 2018
Feb 23, 2018
This chart shows how many new smartphone models selected brands released in 2016 and 2017.
More Information
Magazine Media
Feb 21, 2018
This chart shows the average monthly cross-platform audience of the largest magazine brands in the U.S. in 2017.
More Information
Gaming
Feb 16, 2018
This chart shows a breakdown of estimated revenue of global games market, by segment, from 2015 to 2020.
More Information
Smartphones
Feb 16, 2018
This chart shows global smartphone market share in Q4 2017 based on unit shipments and revenue.
More Information
FT1000
Feb 12, 2018
This chart shows the top 20 FT1000 high-growth companies in Asia-Pacific
More Information
Smartphone market
Feb 5, 2018
This chart compares worldwide smartphone shipments by Apple and Samsung.
More Information
Food Pics
Feb 2, 2018
This chart shows situations where people take pictures of food in the U.S. (December 2017).
More Information
Smartphones
Jan 25, 2018
This chart shows global average smartphone sales prices from 2012 to 2017.
More Information
Smartphone Price Differences
Jan 25, 2018
This chart shows the average smartphone selling price by world region in 2017.
More Information
Artificial Intelligence
Jan 9, 2018
This chart shows how many smartphone users are aware of/using applications featuring machine learning.
More Information
Mobile Devices
Jan 2, 2018
This chart breaks down new device activations in the week leading up to Christmas 2017 by manufacturer.
More Information
Digital photography
Dec 19, 2017
This chart shows the most popular cameras used by Flickr users in 2017.
More Information
Mobile Shopping
Dec 18, 2017
This chart shows the percentage of U.S. e-commerce spending across different categories that was spent on mobile devices in Q3 2017.
More Information
Advertising
Dec 7, 2017
This chart shows the percentage of global advertising revenues that goes to Google and Facebook.
More Information
Quality Of Life
Dec 7, 2017
This chart shows responses to the question: "is life in our country better or worse today than it was 50 years ago?"
More Information
Smartphone Market
Nov 30, 2017
This chart shows the market share of the five largest smartphone vendors in the world, based on unit sales to end users.
More Information
Manufacturing Costs of the iPhone
Nov 16, 2017
This chart compares the iPhone X's estimated manufacturing costs with those of its predecessors.
More Information
Internet Access
Nov 13, 2017
This chart shows the percentage of internet users in selected countries who access the web exclusively via mobile devices.
More Information
Music consumption
Nov 7, 2017
This chart shows how many hours Americans listen to music every week.
More Information
Apple
Nov 3, 2017
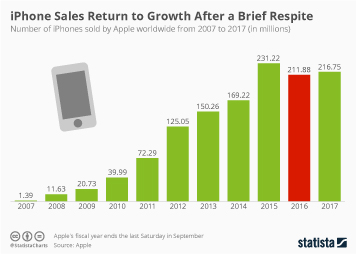
This chart shows iPhones sales since 2007.
More Information
Samsung Electronics
Oct 13, 2017
This chart shows Samsung's quarterly operating profit.
More Information
Microsoft
Oct 10, 2017
This chart shows the market share on mobile/tablet of the Windows 10 Mobile operating system.
More Information
Media Consumption
Sep 27, 2017
This chart shows change in website visits by industry, year-over-year in Q2 2017 (in percent)
More Information
Google
Sep 22, 2017
This chart shows the largest acquisitions by Google (million U.S. dollars).
More Information
Tech
Sep 18, 2017
This chart shows a forecast of the share of devices to be sold worldwide with biometric technology, by type.
More Information
Smartwatch Market
Sep 4, 2017
This chart shows worldwide smartwatch shipments by leading vendors in the second quarter of 2017.
More Information
Technological advances
Sep 1, 2017
This chart shows how many Americans still use devices that are widely considered outdated.
More Information
Digital Photography
Aug 31, 2017
This chart shows how many digital photos are taken worldwide.
More Information
App Usage
Aug 30, 2017
This chart shows how much time smartphone users in the U.S. spend using their personal favorite apps.
More Information
Internet
Aug 29, 2017
This chart shows the share of respondents who can't imagine life without the internet.
More Information
App usage
Aug 28, 2017
This chart shows the Top 10 apps considered essential by U.S. millennials.
More Information
Samsung
Aug 24, 2017
This chart shows whether or not U.S. consumers would consider buying the Samsung Galaxy Note 8 after the problems with the Note 7....
More Information
Media consumption
Jul 31, 2017
This chart shows average weekly smartphone and TV usage of adults in the United States.
More Information
Digital Privacy
Jul 26, 2017
This chart shows the share of Americans who check their partner's text messages at least once a week without permission, by age group.
More Information
Q2 Sales
Jul 24, 2017
This chart shows smartphone units sold in Q2 2017 compared to Q2 2016, by region.
More Information
Smartphones
Jul 4, 2017
This chart shows the share of respondents who use their smartphone to access news in the following locations
More Information
Apple
Jun 29, 2017
This chart shows how Apple has changed since the iPhone's release in 2007.
More Information
Consumer Electronics
Jun 29, 2017
This chart shows which devices have become less popular thanks to the smartphone boom.
More Information
iPhone sales
Jun 28, 2017
This chart shows cumulative iPhone sales since the smartphone's release in 2007.
More Information
BlackBerry's smartphone market share
Jun 26, 2017
This chart shows the decline of BlackBerry's market share since 2009.
More Information
Technology use by U.S. teens
Jun 7, 2017
This chart shows how long U.S. teens think they can go without communication devices.
More Information
Smartphone platform market share
May 31, 2017
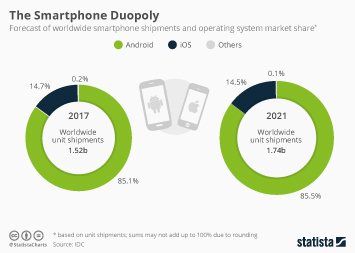
This chart shows a forecast of worldwide smartphone shipments and operating system market share.
More Information
Tech
May 24, 2017
This infographic shows the hours per day spent online via a mobile device, per user.
More Information
Tech
May 22, 2017
This infographic shows smartphone brand retention rates in the United States in 2017.
More Information
Tablet Shipments
May 8, 2017
This chart shows global tablet shipments since 2010.
More Information
Sponsored Post
Apr 25, 2017
This sponsored post details the Q1 2017 results of PUMA.
More Information
Tech
Apr 25, 2017
This infographic shows the share of adults in selected countries that report owning a smartphone.
More Information
Galaxy S8
Apr 21, 2017
This chart shows the features of the Samsung Galaxy S8 that are most attractive to prospective buyers.
More Information
Smartphone Manufacturing Costs
Apr 21, 2017
This chart shows the estimated material and manufacturing costs of selected high-end smartphones.
More Information
Print Media
Apr 20, 2017
This chart shows closures and launches of local/regional newspapers in the UK from 2012 to 2016.
More Information
Smartphones
Apr 20, 2017
This infographic shows the manufacturers with the largest share of global monthly active smartphones and tablets as of July 2016.
More Information
Global device market
Apr 7, 2017
This chart shows Apple's share of the global device market both in terms of value and volume.
More Information
Selfie-related deaths
Apr 4, 2017
This chart shows where the most selfie-related deaths have occured since 2014.
More Information
Samsung unveils the Galaxy S8
Mar 30, 2017
This chart shows Samsung smartphone market share in terms of worldwide unit shipments.
More Information
Video and computer games
Mar 15, 2017
This chart shows which gaming platforms are currently considered the most important by game developers.
More Information
Tech
Mar 2, 2017
This chart shows the average number of months before users upgrade their smartphone in the U.S., China and Europe from 2013 to 2016.
More Information
Smartphone vs. other gadgets
Feb 27, 2017
This chart shows how electronic devices sales have changed since the smartphone boom started 10 years ago.
More Information
Smartphone Market
Feb 20, 2017
This chart shows the changes in smartphone operating system market share since 2009.
More Information
Mobile Internet
Feb 2, 2017
This chart shows how many 4G gigabytes €30 buys on smartphones in selected EU countries
More Information
Digital payments in the United States
Jan 26, 2017
This chart shows the estimated growth in mobile payment transaction volume in the U.S.
More Information
Connected car services
Jan 19, 2017
This chart shows global coverage of real-time traffic information services.
More Information
The decline of the PC industry
Jan 13, 2017
This chart shows global PC shipments since 2006.
More Information
iPhone
Jan 9, 2017
This chart shows selected data on smartphones and the iPhone
More Information
Christmas
Dec 22, 2016
This chart shows the most requested toys in letters sent to Santa via the Royal Mail in 2016.
More Information
Holiday shopping
Dec 19, 2016
This chart shows the most popular technology products people want to give as Christmas presents this year.
More Information
Christmas shopping
Dec 12, 2016
This graphic shows Christmas spending in the Netherlands in 2015, with a forecast for 2016.
More Information
Voice Assistance
Nov 30, 2016
This chart shows U.S. smartphone owners using voice assistance and reasons for use.
More Information
Voice Assistants
Nov 24, 2016
This chart shows the share of UK smartphone users that use an assistant app and for which purpose.
More Information
Holiday shopping season
Nov 22, 2016
This chart shows how Americans use their smartphones while shopping for the holidays.
More Information
Tech
Nov 18, 2016
This chart shows worldwide smartphone end user sales of the top five producers from Q3 2015 to Q3 2016.
More Information
Smartphones
Nov 15, 2016
This chart shows what people will do with their old smartphones when they buy a new one.
More Information
Worldwide smartphone market
Nov 7, 2016
This chart illustrates that the global smartphone market is not a two-horse race between Apple and Samsung.
More Information
Samsung Stops Production of the Galaxy Note 7 Smartphone
Oct 11, 2016
This chart sums up how Samsung ended up scrapping the Galaxy Note 7 smartphone.
More Information
Total Recall
Oct 11, 2016
This chart shows the number of reported incidents concerning the recalled Samsung Galaxy Note 7 in the US
More Information
5
/
8
Contact
Get in touch with us. We are happy to help.
Do you still have questions?
Feel free to contact us anytime using our
contact form
or visit our
FAQ page
.
Your contact to the Infographics Newsroom
Felix Richter
Data Journalist
felix.richter@statista.com
+49 (40) 284 841 557