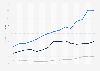
From the selected regions, the ranking by average volume per capita in the 'Gym & Training' segment of the footwear market is led by the United States with 0.23 pairs and is followed by the United Kingdom (0.18 pairs). In contrast, the ranking is trailed by India with 0.01 pairs, recording a difference of 0.22 pairs to the United States.
Data provided by Statista Market Insights are estimates.
Definition:
The Gym & Training footwear market encompasses shoes designed for various fitness and gym activities, including weightlifting, cross-training, aerobics, and other sports. These shoes offer support, flexibility, and traction to enhance performance and safety during workouts.
Additional Information:
The market includes revenue and average revenue per capita, volume and average volume per capita, price per unit (per pair), and sales channels data. Both online and offline distribution channels are relevant. Key players in this market are Nike, Reebok, Under Armour, and Puma.
Profit from the additional features of your individual account
Currently, you are using a shared account. To use individual functions (e.g., mark statistics as favourites, set
statistic alerts) please log in with your personal account.
If you are an admin, please authenticate by logging in again.
Learn more about how Statista can support your business.
Statista. (September 13, 2024). Per-capita volume sales in the athletic footwear market worldwide, by country in 2023 (in pieces) [Graph]. In Statista. Retrieved October 31, 2024, from https://www.statista.com/forecasts/758743/per-capita-volume-sales-in-the-athletic-footwear-market-worldwide-by-country
Statista. "Per-capita volume sales in the athletic footwear market worldwide, by country in 2023 (in pieces)." Chart. September 13, 2024. Statista. Accessed October 31, 2024. https://www.statista.com/forecasts/758743/per-capita-volume-sales-in-the-athletic-footwear-market-worldwide-by-country
Statista. (2024). Per-capita volume sales in the athletic footwear market worldwide, by country in 2023 (in pieces). Statista. Statista Inc.. Accessed: October 31, 2024. https://www.statista.com/forecasts/758743/per-capita-volume-sales-in-the-athletic-footwear-market-worldwide-by-country
Statista. "Per-capita Volume Sales in The Athletic Footwear Market Worldwide, by Country in 2023 (in Pieces)." Statista, Statista Inc., 13 Sep 2024, https://www.statista.com/forecasts/758743/per-capita-volume-sales-in-the-athletic-footwear-market-worldwide-by-country
Statista, Per-capita volume sales in the athletic footwear market worldwide, by country in 2023 (in pieces) Statista, https://www.statista.com/forecasts/758743/per-capita-volume-sales-in-the-athletic-footwear-market-worldwide-by-country (last visited October 31, 2024)
Per-capita volume sales in the athletic footwear market worldwide, by country in 2023 (in pieces) [Graph], Statista, September 13, 2024. [Online]. Available: https://www.statista.com/forecasts/758743/per-capita-volume-sales-in-the-athletic-footwear-market-worldwide-by-country