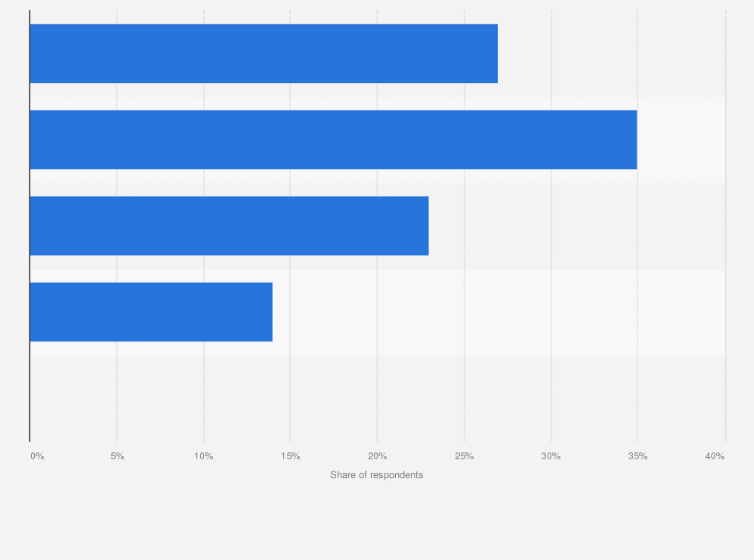
Information on when we delete personal data, the countries where we save data (e.g., US, EU, Singapore), and the companies we collaborate with can be found in our privacy statement.
Our customers work more efficiently and benefit from:
The statistic depicts the preference of 3DTV owners for 2D versus 3D programs. In March of 2011, twenty-three percent of 3DTV owners would watch half of their programs in 2D and half in 3D.
Adjust the presentation of the statistic and data points.
Share the statistic on social media channels or embed the statistic in your
website using "Embed Code", where available.
Cite this statistic and select one of the following formats: APA, Chicago, Harvard, MLA & Bluebook.
Print the statistic including description and metadata.
Chart type
Do you prefer to watch programs in 2D or 3D?
Share this statistic
You have no right to use this feature.
Make sure to contact us if you are interested in scientific citation.
You can upgrade your account to enable this functionality for all statistics.
This feature is not available with your current account.Request access
Based on those owners who watch in 3D. The source does not provide detailed information regarding the questions and possible answers of the survey. The wording chosen here might therefore differ slightly from the wording of the survey. The source does not provide information regarding the missing percentage points to 100 percent.
Learn more about how Statista can support your business.
Digital Entertainment Group. (May 31, 2011). Do you prefer to watch programs in 2D or 3D? [Graph]. In Statista. Retrieved November 16, 2025, from https://www.statista.com/statistics/188984/preference-of-us-3dtv-owners-for-2d-versus-3d-programs/
Digital Entertainment Group. "Do you prefer to watch programs in 2D or 3D?." Chart. May 31, 2011. Statista. Accessed November 16, 2025. https://www.statista.com/statistics/188984/preference-of-us-3dtv-owners-for-2d-versus-3d-programs/
Digital Entertainment Group. (2011). Do you prefer to watch programs in 2D or 3D?. Statista. Statista Inc.. Accessed: November 16, 2025. https://www.statista.com/statistics/188984/preference-of-us-3dtv-owners-for-2d-versus-3d-programs/
Digital Entertainment Group. "Do You Prefer to Watch Programs in 2d or 3d?." Statista, Statista Inc., 31 May 2011, https://www.statista.com/statistics/188984/preference-of-us-3dtv-owners-for-2d-versus-3d-programs/
Digital Entertainment Group, Do you prefer to watch programs in 2D or 3D? Statista, https://www.statista.com/statistics/188984/preference-of-us-3dtv-owners-for-2d-versus-3d-programs/ (last visited November 16, 2025)
Do you prefer to watch programs in 2D or 3D? [Graph], Digital Entertainment Group, May 31, 2011. [Online]. Available: https://www.statista.com/statistics/188984/preference-of-us-3dtv-owners-for-2d-versus-3d-programs/
Advertisement
Profit from additional features with an Employee Account
Please create an employee account to be able to mark statistics as favorites.
Then you can access your favorite statistics via the star in the header.
Profit from the additional features of your individual account
Currently, you are using a shared account. To use individual functions (e.g., mark statistics as favourites, set
statistic alerts) please log in with your personal account.
If you are an admin, please authenticate by logging in again.