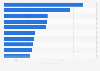
This statistic presents the percentage of Gen C online users who visit YouTube on a daily or weekly basis. As of Summer 2013, it was found that 76 percent of Gen C users worldwide visited the online video platform at least once per week. Furthermore, 36 percent of Gen C accessed YouTube on a daily basis.
Percentage of Gen C users who visit YouTube on a weekly and daily basis as of Summer 2013
Loading statistic...
Basic Account
Get to know the platform
You only have access to basic statistics.
Starter Account
The ideal entry-level account for individual users
- Instant access to 1m statistics
- Download in XLS, PDF & PNG format
- Detailed references
$199 USD / Month *
Professional Account
Full access
Business Solutions including all features.
* Prices do not include sales tax.
Other statistics that may interest you Statistics on
About the industry
9
- Premium Statistic Millennials: popular video categories 2015
- Premium Statistic Penetration of smartphone video viewing in Poland 2018, by generation
- Basic Statistic Leading YouTube content categories of female U.S. Millennials 2016
- Premium Statistic U.S. digital video reach 2019, by age group
- Premium Statistic Smartphone TV series viewing in Poland 2018, by generation
- Premium Statistic Leading online video categories in the United States 2017
- Premium Statistic Leading online video categories in the United States 2017, by age group
- Basic Statistic Leading online video categories in the United States 2017, by gender
- Basic Statistic Leading YouTube content categories of male U.S. Millennials 2016
About the region
10
- Basic Statistic Most popular YouTube content categories 2018, by uploads
- Premium Statistic Global number of YouTube viewers 2016-2021
- Premium Statistic Global YouTube user growth 2016-2021
- Premium Statistic YouTube: most subscribed gaming channels 2024
- Basic Statistic YouTube: most subscribed beauty content creators 2024
- Basic Statistic Global Vimeo quarterly subscribers 2015-2021
- Premium Statistic Ongoing home media consumption and the coronavirus worldwide 2020, by country
- Premium Statistic Continued home media consumption and the coronavirus worldwide 2020, by country
- Premium Statistic Media consumption increase due to the coronavirus worldwide 2020, by country
- Basic Statistic Most popular YouTube content categories 2018, by views
Selected statistics
1
Other regions
8
- Premium Statistic Video on-demand services in Denmark 2019, by genre
- Basic Statistic Legal video services market revenue share in Russia 2019-2022, by segment
- Premium Statistic Central America & the Caribbean: number of YouTube users by country 2017
- Premium Statistic On-demand audiovisual services in Sweden 2019, by type
- Premium Statistic On-demand audiovisual services in Iceland 2019, by genre
- Premium Statistic Time spent watching video content in the U.S. Q3 2020, by screen
- Premium Statistic Most in-demand digital original shows in Sweden 2021
- Premium Statistic Revenue distribution of online video industry in China 2015-2023
Related statistics
10
- Basic Statistic YouTube usage frequency in the United States 2020
- Basic Statistic U.S. YouTube usage reasons 2019
- Premium Statistic YouTube viewers in the United States 2018-2022
- Premium Statistic YouTube user growth in the United States 2014-2019
- Premium Statistic Most popular platforms used to watch live streams in the U.S. 2022, by age group
- Basic Statistic Most popular U.S. YouTube partner channels 2023, ranked by viewers
- Premium Statistic Fastest growing UK TikTok influencers 2021, by number of followers
- Premium Statistic Fastest growing UK TikTok influencers 2021, by engagement rate
- Premium Statistic U.S. parents on how often under-11 children watch YouTube 2020
- Premium Statistic Distribution of TikTok influencer accounts in the UK in 2020, by number of posts
Further related statistics
8
- Social network profile creation in the UK 2010-2020, by socio-economic group
- Netflix's annual revenue 2002-2023
- Retail video market: consumer spending on physical video in France 2008-2022
- Households with internet access in GB from 2014 to 2020, by household composition
- User numbers of microblogs in China 2010-2018
- Average time spent with magazines in North America in 2018, by format
- Concerns about connected devices use in the United Kingdom (UK) 2013-2014
- Reasons for using social media to get a customer service response 2012
Further Content: You might find this interesting as well
Statistics
- Social network profile creation in the UK 2010-2020, by socio-economic group
- Netflix's annual revenue 2002-2023
- Retail video market: consumer spending on physical video in France 2008-2022
- Households with internet access in GB from 2014 to 2020, by household composition
- User numbers of microblogs in China 2010-2018
- Average time spent with magazines in North America in 2018, by format
- Concerns about connected devices use in the United Kingdom (UK) 2013-2014
- Reasons for using social media to get a customer service response 2012
YouTube. (January 30, 2014). Percentage of Gen C users who visit YouTube on a weekly and daily basis as of Summer 2013 [Graph]. In Statista. Retrieved May 09, 2024, from https://www.statista.com/statistics/290418/daily-and-weekly-gen-c-youtube-viewership-worldwide/
YouTube. "Percentage of Gen C users who visit YouTube on a weekly and daily basis as of Summer 2013." Chart. January 30, 2014. Statista. Accessed May 09, 2024. https://www.statista.com/statistics/290418/daily-and-weekly-gen-c-youtube-viewership-worldwide/
YouTube. (2014). Percentage of Gen C users who visit YouTube on a weekly and daily basis as of Summer 2013. Statista. Statista Inc.. Accessed: May 09, 2024. https://www.statista.com/statistics/290418/daily-and-weekly-gen-c-youtube-viewership-worldwide/
YouTube. "Percentage of Gen C Users Who Visit Youtube on a Weekly and Daily Basis as of Summer 2013." Statista, Statista Inc., 30 Jan 2014, https://www.statista.com/statistics/290418/daily-and-weekly-gen-c-youtube-viewership-worldwide/
YouTube, Percentage of Gen C users who visit YouTube on a weekly and daily basis as of Summer 2013 Statista, https://www.statista.com/statistics/290418/daily-and-weekly-gen-c-youtube-viewership-worldwide/ (last visited May 09, 2024)
Percentage of Gen C users who visit YouTube on a weekly and daily basis as of Summer 2013 [Graph], YouTube, January 30, 2014. [Online]. Available: https://www.statista.com/statistics/290418/daily-and-weekly-gen-c-youtube-viewership-worldwide/