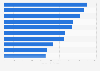
The statistic displays the venues most played in by the national soccer team of Belgium as of August 2021, by number of matches played. As of this point in time, the national soccer team of Belgium played most of their matches in King Baudouin Stadium in Brussels with 211 matches played there.
Venues most played in by the national soccer team of Belgium as of August 2021, by number of matches
Release date is the date of access.
The source adds the following information: "Venue names are those at the time of the game. Some stadiums may appear more than once under different names."
Profit from the additional features of your individual account
Currently, you are using a shared account. To use individual functions (e.g., mark statistics as favourites, set
statistic alerts) please log in with your personal account.
If you are an admin, please authenticate by logging in again.
Learn more about how Statista can support your business.
Association of football statisticians. (August 16, 2021). Venues most played in by the national soccer team of Belgium as of August 2021, by number of matches [Graph]. In Statista. Retrieved November 09, 2024, from https://www.statista.com/statistics/577115/venues-most-played-in-by-national-football-team-by-matches-played-belgium/
Association of football statisticians. "Venues most played in by the national soccer team of Belgium as of August 2021, by number of matches." Chart. August 16, 2021. Statista. Accessed November 09, 2024. https://www.statista.com/statistics/577115/venues-most-played-in-by-national-football-team-by-matches-played-belgium/
Association of football statisticians. (2021). Venues most played in by the national soccer team of Belgium as of August 2021, by number of matches. Statista. Statista Inc.. Accessed: November 09, 2024. https://www.statista.com/statistics/577115/venues-most-played-in-by-national-football-team-by-matches-played-belgium/
Association of football statisticians. "Venues Most Played in by The National Soccer Team of Belgium as of August 2021, by Number of Matches." Statista, Statista Inc., 16 Aug 2021, https://www.statista.com/statistics/577115/venues-most-played-in-by-national-football-team-by-matches-played-belgium/
Association of football statisticians, Venues most played in by the national soccer team of Belgium as of August 2021, by number of matches Statista, https://www.statista.com/statistics/577115/venues-most-played-in-by-national-football-team-by-matches-played-belgium/ (last visited November 09, 2024)
Venues most played in by the national soccer team of Belgium as of August 2021, by number of matches [Graph], Association of football statisticians, August 16, 2021. [Online]. Available: https://www.statista.com/statistics/577115/venues-most-played-in-by-national-football-team-by-matches-played-belgium/