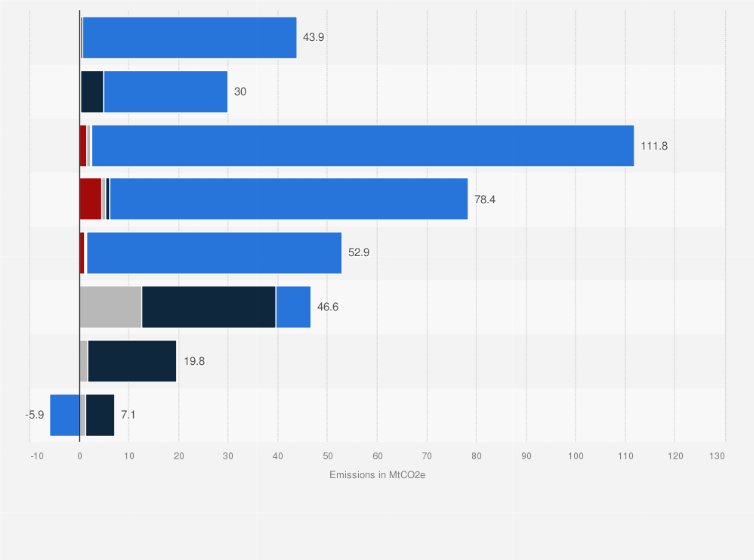
Carbon dioxide is the primary greenhouse gas emitted by sectors like transportation, electricity supply, and buildings. In 2023, UK domestic transportation produced roughly 110 million metric tons of carbon dioxide, accounting for roughly 97 percent of the sector's total emissions that year.
By comparison, methane is the most produced greenhouse gas in sectors such as agriculture and waste management.
Greenhouse gas emissions in the United Kingdom (UK) in 2023, by gas and sector
(in million metric tons of carbon dioxide equivalent)
Adjust the presentation of the statistic and data points.
Share the statistic on social media channels or embed the statistic in your
website using "Embed Code", where available.
Cite this statistic and select one of the following formats: APA, Chicago, Harvard, MLA & Bluebook.
Print the statistic including description and metadata.
Chart type
Greenhouse gas emissions in the United Kingdom (UK) in 2023, by gas and sector
Share this statistic
You have no right to use this feature.
Make sure to contact us if you are interested in scientific citation.
You can upgrade your account to enable this functionality for all statistics.
This feature is not available with your current account.Request access
Statista has been my savior on several occasions.
The site is easy to maneuver and the data is in a format that can
go right into a report or presentation.
Learn more about how Statista can support your business.
Department for Energy Security and Net-Zero (UK). (February 6, 2025). Greenhouse gas emissions in the United Kingdom (UK) in 2023, by gas and sector (in million metric tons of carbon dioxide equivalent) [Graph]. In Statista. Retrieved April 04, 2025, from https://www.statista.com/statistics/780263/greenhouse-gas-emissions-by-gas-united-kingdom-uk/
Department for Energy Security and Net-Zero (UK). "Greenhouse gas emissions in the United Kingdom (UK) in 2023, by gas and sector (in million metric tons of carbon dioxide equivalent)." Chart. February 6, 2025. Statista. Accessed April 04, 2025. https://www.statista.com/statistics/780263/greenhouse-gas-emissions-by-gas-united-kingdom-uk/
Department for Energy Security and Net-Zero (UK). (2025). Greenhouse gas emissions in the United Kingdom (UK) in 2023, by gas and sector (in million metric tons of carbon dioxide equivalent). Statista. Statista Inc.. Accessed: April 04, 2025. https://www.statista.com/statistics/780263/greenhouse-gas-emissions-by-gas-united-kingdom-uk/
Department for Energy Security and Net-Zero (UK). "Greenhouse Gas Emissions in The United Kingdom (Uk) in 2023, by Gas and Sector (in Million Metric Tons of Carbon Dioxide Equivalent)." Statista, Statista Inc., 6 Feb 2025, https://www.statista.com/statistics/780263/greenhouse-gas-emissions-by-gas-united-kingdom-uk/
Department for Energy Security and Net-Zero (UK), Greenhouse gas emissions in the United Kingdom (UK) in 2023, by gas and sector (in million metric tons of carbon dioxide equivalent) Statista, https://www.statista.com/statistics/780263/greenhouse-gas-emissions-by-gas-united-kingdom-uk/ (last visited April 04, 2025)
Greenhouse gas emissions in the United Kingdom (UK) in 2023, by gas and sector (in million metric tons of carbon dioxide equivalent) [Graph], Department for Energy Security and Net-Zero (UK), February 6, 2025. [Online]. Available: https://www.statista.com/statistics/780263/greenhouse-gas-emissions-by-gas-united-kingdom-uk/
Profit from additional features with an Employee Account
Please create an employee account to be able to mark statistics as favorites.
Then you can access your favorite statistics via the star in the header.
Profit from the additional features of your individual account
Currently, you are using a shared account. To use individual functions (e.g., mark statistics as favourites, set
statistic alerts) please log in with your personal account.
If you are an admin, please authenticate by logging in again.