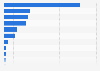
This statistic shows the revenue of the industry "Manufacture of parts and accessories for motor vehicles" in India from 2012 to 2017, with a forecast to 2024. It is projected that the revenue of Manufacture of parts and accessories for motor vehicles in India will amount to approximately 50,9 billion U.S. Dollars by 2024.
Industry revenue of "Manufacture of parts and accessories for motor vehicles" in India from 2012 to 2024 (in billion U.S. Dollars)
Other statistics that may interest you Statistics on
About the industry
10
- Premium Statistic Production volume of pickups Thailand 2023, by type
- Premium Statistic Production volume of trucks Thailand 2023, by type
- Premium Statistic U.S. motor vehicle and parts advanced retail trade revenue 2000-2022
- Premium Statistic Toyota worldwide vehicle production 2007-2023
- Premium Statistic Magna: R&D costs 2016-2022
- Premium Statistic Magna: sales by region 2022
- Premium Statistic Magna: sales by segment 2022
- Premium Statistic Motor vehicle and parts manufacturing gross output in U.S. 2012-2022
- Premium Statistic Continental's research and development expenses 2017 to 2022
- Premium Statistic Global net sales of Aptiv by region 2020-2022
About the region
10
- Premium Statistic Production value of electronics in India FY 2010-2022
- Premium Statistic Production value of electronics in India FY 2022, by type
- Premium Statistic Light emitting diodes (LED) production value in India FY 2014-2022
- Premium Statistic Consumer electronics production value in India FY 2014-2022
- Premium Statistic Industrial electronics production value in India FY 2014-2022
- Premium Statistic Computer hardware production value in India FY 2014-2022
- Premium Statistic Purchasing Managers' Index (PMI) in India September 2023
- Premium Statistic Proposed investment value in vegetable oils in India 2011-2022
- Premium Statistic Proposed investment value in the industrial machinery sector in India 2011-2022
- Premium Statistic Proposed investment value in agricultural machinery in India 2011-2022
Other regions
10
- Premium Statistic Global palladium consumption distribution 2022, by region
- Premium Statistic Monthly manufacturer sales of office furniture in Canada 2014-2022
- Basic Statistic E-commerce share of B2B and B2C shipments, sales and revenues in the U.S. 2019-2020
- Premium Statistic Number of firms in the office furniture manufacturing industry in Italy 2010-2019
- Basic Statistic Tire production in Europe 2005-2018
- Premium Statistic Health functional food sales ratio to GDP of manufacturing in South Korea 2015-2021
- Premium Statistic China's outward FDI stock in Africa 2022, by sector
- Premium Statistic Value of non-residential building consents New Zealand 2022, by type
- Premium Statistic Producer Price Index (PPI) for the manufacturing industry in Morocco 2019-2022
- Basic Statistic Leading countries in cosmetic breast surgery in Latin America 2021, by share
Related statistics
10
- Premium Statistic Industry revenue of “rental and leasing of office euipment“ in Germany 2012-2025
- Premium Statistic Industry revenue of “manufacture of office machinery and equipment“ in Germany 2012-2025
- Premium Statistic Industry revenue of “manufacture of electronic components“ in Germany 2012-2025
- Premium Statistic Industry revenue of “pre-press and pre-media services“ in Germany 2012-2025
- Premium Statistic Industry revenue of “manufacture of oils and fats“ in Germany 2012-2025
- Premium Statistic Industry revenue of “manufacture of oils and fats“ in Greece 2012-2025
- Premium Statistic Industry revenue of “manufacture of office machinery and equipment“ in Finland 2012-2025
- Premium Statistic Industry revenue of “pre-press and pre-media services“ in Finland 2012-2025
- Premium Statistic Industry revenue of “manufacture of electronic components“ in Romania 2012-2025
- Premium Statistic Industry revenue of “manufacture of oils and fats“ in Romania 2012-2025
Further related statistics
10
- NortonLifeLock: net revenue 2012-2023, by region
- Net sales of GameStop worldwide 2010-2022, by region
- Mondelez International's global workforce by region 2012-2022
- Global revenue share of EssilorLuxottica in 2022, by geographical area
- Pfizer's revenues in the U.S. and abroad 2009-2022
- Secondhand goods: Sales volume percentage change in Great Britain (UK) 2013-2022
- Global oil production share 2010-2022, by region
- ExxonMobil's petroleum product sales 2001-2021
- ExxonMobil Chemical's prime product sales 2001-2021
- Annual silver production of Coeur Mining 2010-2021
Further Content: You might find this interesting as well
Statistics
- NortonLifeLock: net revenue 2012-2023, by region
- Net sales of GameStop worldwide 2010-2022, by region
- Mondelez International's global workforce by region 2012-2022
- Global revenue share of EssilorLuxottica in 2022, by geographical area
- Pfizer's revenues in the U.S. and abroad 2009-2022
- Secondhand goods: Sales volume percentage change in Great Britain (UK) 2013-2022
- Global oil production share 2010-2022, by region
- ExxonMobil's petroleum product sales 2001-2021
- ExxonMobil Chemical's prime product sales 2001-2021
- Annual silver production of Coeur Mining 2010-2021
MOSPI. (February 3, 2021). Industry revenue of "Manufacture of parts and accessories for motor vehicles" in India from 2012 to 2024 (in billion U.S. Dollars) [Graph]. In Statista. Retrieved December 03, 2023, from https://www.statista.com/forecasts/1054287/manufacture-of-parts-and-accessories-for-motor-vehicles-revenue-in-india
MOSPI. "Industry revenue of "Manufacture of parts and accessories for motor vehicles" in India from 2012 to 2024 (in billion U.S. Dollars)." Chart. February 3, 2021. Statista. Accessed December 03, 2023. https://www.statista.com/forecasts/1054287/manufacture-of-parts-and-accessories-for-motor-vehicles-revenue-in-india
MOSPI. (2021). Industry revenue of "Manufacture of parts and accessories for motor vehicles" in India from 2012 to 2024 (in billion U.S. Dollars). Statista. Statista Inc.. Accessed: December 03, 2023. https://www.statista.com/forecasts/1054287/manufacture-of-parts-and-accessories-for-motor-vehicles-revenue-in-india
MOSPI. "Industry Revenue of "Manufacture of Parts and Accessories for Motor Vehicles" in India from 2012 to 2024 (in Billion U.S. Dollars)." Statista, Statista Inc., 3 Feb 2021, https://www.statista.com/forecasts/1054287/manufacture-of-parts-and-accessories-for-motor-vehicles-revenue-in-india
MOSPI, Industry revenue of "Manufacture of parts and accessories for motor vehicles" in India from 2012 to 2024 (in billion U.S. Dollars) Statista, https://www.statista.com/forecasts/1054287/manufacture-of-parts-and-accessories-for-motor-vehicles-revenue-in-india (last visited December 03, 2023)
Industry revenue of "Manufacture of parts and accessories for motor vehicles" in India from 2012 to 2024 (in billion U.S. Dollars) [Graph], MOSPI, February 3, 2021. [Online]. Available: https://www.statista.com/forecasts/1054287/manufacture-of-parts-and-accessories-for-motor-vehicles-revenue-in-india