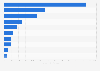
The chart for the household consumption expenditure on glassware, tableware, and household utensils in Turkey shows a steady increase from 2002 to 2022. The expenditure on this product group peaked in 2022 at over 1.5 billion Turkish lira.
Household consumption expenditure on glassware, tableware and household utensils in Turkey from 2002 to 2022 (in 1,000 Turkish lira per month)
Basic Account
Get to know the platform
You only have access to basic statistics.
This statistic is not included in your account.
Starter Account
The ideal entry-level account for individual users
- Instant access to 1m statistics
- Download in XLS, PDF & PNG format
- Detailed references
$199 USD / Month *
Professional Account
Full access
Business Solutions including all features.
* Prices do not include sales tax.
Other statistics that may interest you Statistics on
About the industry
10
- Premium Statistic Glassware & utensils: weekly household expenditure in the UK 2016-2022, by type
- Premium Statistic Average household expenditure on food processors in Denmark 2011-2022
- Basic Statistic Consumer expenditure on household appliances in Czechia 2010-2022
- Basic Statistic Consumer expenditure on household appliances in Finland 2011-2022
- Premium Statistic Household appliances: weekly household expenditure in the UK 2022, by type
- Premium Statistic Home & garden tools: weekly household expenditure in the UK 2022, by type
- Premium Statistic Average household expenditure on lighting equipment in Denmark 2011-2022
- Premium Statistic Average household expenditure on refrigerators and freezers Denmark 2011-2022
- Premium Statistic Average household expenditure on stoves in Denmark 2011-2022
- Premium Statistic Average household expenditure on heaters and air conditioners in Denmark 2011-2022
About the region
9
- Premium Statistic Consumer spending on household textiles in Turkey 2002-2022
- Premium Statistic Household expenditure on clothing in Turkey 2002-2022
- Premium Statistic Household expenditure on footwear in Turkey 2002-2022
- Premium Statistic Household expenditure on furniture in Turkey 2002-2022
- Premium Statistic Household consumption expenditure on restaurants and hotels in Turkey 2009-2021
- Basic Statistic Turkey: monthly consumer price index for health 2018-2020
- Premium Statistic Share of household expenditure on restaurants and hotels in Turkey 2010-2022
- Basic Statistic Turkey: monthly consumer price index for communications in 2018
- Basic Statistic Turkey: monthly CPI for food and non-alcoholic beverages 2017-2018
Other regions
10
- Premium Statistic Household textiles: weekly household expenditure in the UK 2016-2022, by type
- Premium Statistic Household consumption expenditure on alcohol and tobacco in Norway 2010-2022
- Premium Statistic Consumer spending on medical products, appliances and equipment in Poland 2010-2022
- Premium Statistic Monthly expenditure for lactose-free food in France 2019
- Premium Statistic Monthly household expenditure in Myanmar 2012, by state
- Premium Statistic Average monthly household expenditure in Thailand 2016, by income
- Premium Statistic Household consumption expenditure on sport and camping equipment in Sweden 2008-2021
- Basic Statistic Consumer consumption on household appliances in Spain 2009-2018
- Basic Statistic Household services: Scottish Household Final Consumption Expenditure 2000-2018
- Basic Statistic Impact on consumers' spending due to COVID-19 in Vietnam 2020, by sector
Related statistics
3
Further related statistics
5
- LG Electronics revenue by segment 2016-2023, by quarter
- Consumer expenditure on video and audio equipment in the U.S. 1999-2019
- Consumer expenditure on live entertainment in the U.S. 1999-2013
- Consumer expenditure on photo studios in the U.S. 1999-2013
- Percentage of Millennials with credit cards in the U.S. 1989-2007
Further Content: You might find this interesting as well
Statistics
- LG Electronics revenue by segment 2016-2023, by quarter
- Consumer expenditure on video and audio equipment in the U.S. 1999-2019
- Consumer expenditure on live entertainment in the U.S. 1999-2013
- Consumer expenditure on photo studios in the U.S. 1999-2013
- Percentage of Millennials with credit cards in the U.S. 1989-2007
TurkStat. (October 9, 2023). Household consumption expenditure on glassware, tableware and household utensils in Turkey from 2002 to 2022 (in 1,000 Turkish lira per month) [Graph]. In Statista. Retrieved April 26, 2024, from https://www.statista.com/statistics/883659/household-spending-on-glassware-turkey/
TurkStat. "Household consumption expenditure on glassware, tableware and household utensils in Turkey from 2002 to 2022 (in 1,000 Turkish lira per month)." Chart. October 9, 2023. Statista. Accessed April 26, 2024. https://www.statista.com/statistics/883659/household-spending-on-glassware-turkey/
TurkStat. (2023). Household consumption expenditure on glassware, tableware and household utensils in Turkey from 2002 to 2022 (in 1,000 Turkish lira per month). Statista. Statista Inc.. Accessed: April 26, 2024. https://www.statista.com/statistics/883659/household-spending-on-glassware-turkey/
TurkStat. "Household Consumption Expenditure on Glassware, Tableware and Household Utensils in Turkey from 2002 to 2022 (in 1,000 Turkish Lira per Month)." Statista, Statista Inc., 9 Oct 2023, https://www.statista.com/statistics/883659/household-spending-on-glassware-turkey/
TurkStat, Household consumption expenditure on glassware, tableware and household utensils in Turkey from 2002 to 2022 (in 1,000 Turkish lira per month) Statista, https://www.statista.com/statistics/883659/household-spending-on-glassware-turkey/ (last visited April 26, 2024)
Household consumption expenditure on glassware, tableware and household utensils in Turkey from 2002 to 2022 (in 1,000 Turkish lira per month) [Graph], TurkStat, October 9, 2023. [Online]. Available: https://www.statista.com/statistics/883659/household-spending-on-glassware-turkey/