Skip to main content
Consumer Goods & FMCG
E-Commerce
Economy & Politics
Energy & Environment
Health, Pharma & Medtech
Internet
Media
Technology & Telecommunications
Transportation & Logistics
Travel, Tourism & Hospitality
View all industries
Global data volume growth
Global AI market size
Number of generative AI users worldwide
Global inflation rate
Retail e-commerce sales worldwide
Largest economies worldwide
Biggest social media platforms by users
Global EV market share by manufacturer
International tourist arrivals by world region
Global annual CO₂ emissions
Browse recent statistics
Artificial intelligence (AI) worldwide
TikTok
Nvidia
E-commerce worldwide
Global GDP
Instagram
Apparel market worldwide
Video gaming worldwide
Global renewable energy industry
Influencer marketing worldwide
Browse recent topics
Consumer Trends 2026
Artificial Intelligence: in-depth market analysis
E-commerce challenges
Global economy
TikTok
Luxury goods: in-depth market analysis
Electric vehicles: A global overview
Video gaming worldwide
Travel and tourism trends 2026
Battery recycling worldwide
Browse recent reports
Explore the tool
Explore Classic mode
Advertising & Media
eCommerce
Consumer
Finance
Global Indicators
Health
Industrial
Mobility
Technology
Explore Market Insights
eCommerce Insights
Research AI
Book a demo
All integrations
Developer docs
Explore Statista Connect
Research
Strategy & Consulting
Marketing
Media & PR
Explore AI assistants
Marketing
Research & Development
Strategy
Sales
Find the fact
Tell the story
Win the pitch
Understand the market
Develop your strategy
Academia
Agencies
Consultancies
Consumer goods
Finance
Tech
Research solutions
Strategy consulting
Communication services
Explore Statista+
Statista R
Statista Healthcare
About Statista
First steps & help center
Webinar & training hub
Success stories
Individuals & Small Teams
Businesses & Enterprises
Academia & Government
English
Deutsch
Daily Data
Global stories vividly visualized
Jan 31, 2014
This chart illustrates how Apple's lead in the tablet market is slowly melting away as the company's competitors are finally gaining...
More Information
Jan 31, 2014
This chart shows the lowest outdoor stadium temperatures at the Super Bowl.
More Information
Jan 30, 2014
This chart shows the NFL teams with the most Super Bowl appearances and wins.
More Information
Jan 30, 2014
This chart illustrates Facebook’s impressive user growth since its inception in 2004.
More Information
Jan 30, 2014
This chart shows TV viewership of the Super Bowl in the United States from 1991 to 2013.
More Information
Jan 29, 2014
This chart shows population growth in the world’s top 15 megacities.
More Information
Jan 29, 2014
This infographic illustrates some interesting facts about one of the most urgent health issues the United States is currently facing:...
More Information
Jan 28, 2014
This chart illustrates how Apple’s growth has all but disappeared in the past few quarters.
More Information
Jan 28, 2014
This chart shows how many smartphones the world's largest smartphone vendors shipped in 2012 and 2013.
More Information
Jan 27, 2014
This chart shows the growth of broadcasting rights fees paid by U.S. networks to air the Winter Olympics since 1984. In 1984, ABC paid...
More Information
Jan 24, 2014
This chart shows milestones of the Mac evolution (by CPU power).
More Information
Jan 23, 2014
This chart shows football clubs’ revenues by source 2012/13 (in million euros)
More Information
Jan 23, 2014
This chart shows lobbying expenditure of selected tech companies in the United States in 2013.
More Information
Jan 23, 2014
This chart shows the percentage of U.S. smartphone users with some sort of alert in these categories.
More Information
Jan 22, 2014
This chart shows the top destination cities by international overnight visitors in 2013.
More Information
Jan 22, 2014
This chart shows the companies that received the most media coverage in 2013. Dow Jones tracks English-language print publications...
More Information
Jan 21, 2014
This chart shows the number of visitors and percentage growth in foreign tourism in India (January to April).
More Information
Jan 20, 2014
This chart shows the number of dolphins killed in Taiji drive hunts from 2002 to 2012.
More Information
Jan 20, 2014
This infographic illustrates key facts on tobacco production and consumption in the United States.
More Information
Jan 17, 2014
This chart ranks the 15 companies that have been granted the most U.S. patents in 2013.
More Information
Jan 16, 2014
This chart shows the college degrees with the highest starting salaries in the United States in 2013.
More Information
Jan 16, 2014
This chart illustrates how young Americans are apparently losing interest in facebook. Since January 2011, the number of users aged...
More Information
Jan 16, 2014
This chart provides an overview of electric and hybrid vehicles.
More Information
Jan 15, 2014
This charts shows a genre breakdown of album sales in the United States in 2013. Rock, R&B and Alternative were the most popular genres...
More Information
Jan 14, 2014
This chart shows the percentage of respondents saying that “married people having an affair is morally unacceptable”.
More Information
Jan 14, 2014
This chart illustrates how much app usage has increased over the past 12 months.
More Information
Jan 13, 2014
This chart shows the football players with the most Ballon d’Or awards.
More Information
Jan 13, 2014
This chart shows Google's largest acquisitions. The search giant made several billion-dollar deals in the past decade with Nest being...
More Information
Jan 12, 2014
This chart shows the actors and actresses with the most Golden Globe nominations and wins.
More Information
Jan 10, 2014
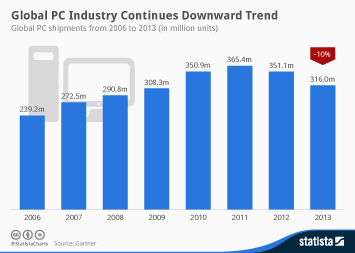
This chart shows global PC shipments from 2006 through 2013. In 2013, 316 million PCs were shipped worldwide, a 10 percent decline...
More Information
Jan 9, 2014
E.U. and U.S. meat imports and exports between 2010 and 2012 (in million U.S. dollars)
More Information
Jan 8, 2014
This chart deals with technology adoption among Americans of different age. It shows how great the divide between young adults and...
More Information
Jan 7, 2014
This chart shows the percentage of workers with a 60-minute commute in U.S. cities.
More Information
Jan 6, 2014
This chart shows vessels hijacked and pirate related activity off the coast of Somalia from 2008 to January 2014.
More Information
Vinyl LP
Jan 6, 2014
During the past ten years, one of the most challenging decades ever for the music industry, the good old vinyl LP has made a surprising...
More Information
Jan 5, 2014
This chart shows the coldest U.S. states by average monthly and coldest ever temperatures.
More Information
Jan 5, 2014
This chart shows a country ranking based on estimated per capita expenditure on information and communications technology in 2013.
More Information
Jan 2, 2014
This chart illustrates how many Americans have had accidents related to on-the-go cell phone usage.
More Information
Jan 2, 2014
This chart shows the percentage of poorest and richest residents holding a fifth of collective household income.
More Information
Jan 1, 2014
This chart shows how selected public technology companies have performed at the stock market in 2013.
More Information
Dec 18, 2013
This chart shows the top selling domestic beers in the United States in 2012.
More Information
Dec 18, 2013
This chart breaks down the revenue of each of the App Store's 10 primary categories, between freemium apps with in-app purchases, paid...
More Information
Dec 16, 2013
This chart shows the distribution of languages on <a href="/topics/737/twitter/">Twitter</a>. According to Semiocast, only 34% of all...
More Information
Dec 12, 2013
This chart shows the highest and average team values across America’s sporting leagues in 2013 (in million U.S. dollars).
More Information
Dec 12, 2013
This chart illustrates that online video consumption greatly varies across different age groups. Younger adults are much more likely...
More Information
Dec 11, 2013
This chart shows the most-commonly visited types of websites in the world.
More Information
Dec 11, 2013
Facebook's significance as a traffic source for publishers is constantly growing. According to <a href="https://blog.shareaholic.com/facebook-referrals-skyrocket-12-2013/">Shareaholic</a>,...
More Information
Dec 10, 2013
This chart shows the 10 cities with the highest estimated spending on anti-ACA advertising in 2013.
More Information
Dec 10, 2013
It's been a little more than a month now since Twitter made its stock market debut in the most-anticipated IPO since Facebook went...
More Information
Dec 9, 2013
Facebook's smartphone app is the most-commonly used app in the United States. According to comScore, more than 75% of adult Android...
More Information
Dec 5, 2013
While experts are busy arguing about when traditional TV should officially be declared dead, people continue to do what they have always...
More Information
Dec 5, 2013
This chart shows the violent crime rate per 100,000 residents in U.S. cities in 2013.
More Information
Dec 4, 2013
This chart shows the Pay-TV services American adults from different age groups subscribe to. While the majority of those aged 49 and...
More Information
Dec 4, 2013
This chart shows daily e-commerce sales during the holiday season. With sales of $1.74 billion, Cyber Monday was the largest online...
More Information
Dec 4, 2013
Does the U.S. play a more or less important role as world leader compared to 10 years ago?
More Information
Dec 3, 2013
This chart illustrates the age structure of social networks in the United States. 50% of Twitter's unique visitors in October 2013...
More Information
Dec 3, 2013
This chart illustrates how Bitcoin activity stacks up against other payment networks. Daily Bitcoin transaction volume is already higher...
More Information
Dec 3, 2013
This chart shows annual visitors to the most popular ski resorts in the United States between 2008 and 2011.
More Information
Dec 2, 2013
This chart displays the main reasons offline adults in the states don't use the internet.
More Information
Dec 2, 2013
This chart shows the number of patients per psychiatrist in EU countries.
More Information
Nov 29, 2013
This chart shows the leading countries for citizen acquisition in the EU in 2011.
More Information
Nov 27, 2013
The global smartphone market continues to grow. One of the biggest drivers behind future growth will be the continous decline of the...
More Information
Nov 27, 2013
This chart shows countries with the highest number of jailed journalists (as of December 1, 2012).
More Information
Nov 27, 2013
Traditionally, Black Friday is one of the biggest days for U.S. retailers. However, according to a Deloitte survey, only 11% of Americans...
More Information
Nov 27, 2013
The Friday after Thanksgiving (Black Friday) marks the inofficial starting point of the holiday shopping season in the United States....
More Information
Nov 26, 2013
Ever since Ashton Kutcher beat CNN to the 1-million followers mark in April 2009, only five different celebrities have been crowned...
More Information
Nov 26, 2013
This chart shows worldwide coverage and the percentage increase in tobacco control policies.
More Information
Nov 25, 2013
This chart provides an overview of worldwide wealth distribution.
More Information
Nov 25, 2013
They text, they tweet, they share whatever they do online. No generation before them has grown up as connected as today's teenagers....
More Information
Nov 22, 2013
Mobile internet access continues to become more and more common across the globe. Ericsson predicts that the number of mobile internet...
More Information
Nov 21, 2013
San Francisco is the most bike-friendly city in the United States. With 5.6 miles of dedicated bike lanes, multiuse bike paths and...
More Information
Nov 20, 2013
This chart provides a geographic breakdown of Twitter's active user base. 24 percent of Twitter's users who actually tweet are located...
More Information
Nov 19, 2013
This chart shows the performance of right-wing populist parties in European parliamentary elections.
More Information
Nov 19, 2013
Social networks such as Twitter and Facebook are not only used to connect with friends and acquaintances, but also to stay on top of...
More Information
Nov 18, 2013
Despite its average selling price dropping from $675 in Q3 2012 to $635 in this year's September quarter, Apple's iPhone continues...
More Information
Nov 18, 2013
This chart shows the countries with the most pirate attacks from January to September 2013.
More Information
Nov 15, 2013
With roughly 50 million Twitter users, the United States has the largest Twitter population in the world. The number of active users,...
More Information
Nov 14, 2013
Mobile phone users from the Asia-Pacific region consume the most data. Driven by entertainment applications such as YouTube, Youku...
More Information
Nov 14, 2013
An average American child saw more than 1,000 fast food ads in 2012, according to a study published by the Yale Rudd Center for Food...
More Information
153
/
161
Contact
Get in touch with us. We are happy to help.
Do you still have questions?
Feel free to contact us anytime using our
contact form
or visit our
FAQ page
.
Your contact to the Infographics Newsroom
Felix Richter
Data Journalist
felix.richter@statista.com
+49 (40) 284 841 557