Skip to main content
Consumer Goods & FMCG
E-Commerce
Economy & Politics
Energy & Environment
Health, Pharma & Medtech
Internet
Media
Technology & Telecommunications
Transportation & Logistics
Travel, Tourism & Hospitality
View all industries
Global data volume growth
Global AI market size
Number of generative AI users worldwide
Global inflation rate
Retail e-commerce sales worldwide
Largest economies worldwide
Biggest social media platforms by users
Global EV market share by manufacturer
International tourist arrivals by world region
Global annual CO₂ emissions
Browse recent statistics
Artificial intelligence (AI) worldwide
TikTok
Nvidia
E-commerce worldwide
Global GDP
Instagram
Apparel market worldwide
Video gaming worldwide
Global renewable energy industry
Influencer marketing worldwide
Browse recent topics
Consumer Trends 2026
Artificial Intelligence: in-depth market analysis
E-commerce challenges
Global economy
TikTok
Luxury goods: in-depth market analysis
Electric vehicles: A global overview
Video gaming worldwide
Travel and tourism trends 2026
Battery recycling worldwide
Browse recent reports
Explore the tool
Explore Classic mode
Advertising & Media
eCommerce
Consumer
Finance
Global Indicators
Health
Industrial
Mobility
Technology
Explore Market Insights
eCommerce Insights
Research AI
Book a demo
All integrations
Developer docs
Explore Statista Connect
Research
Strategy & Consulting
Marketing
Media & PR
Explore AI assistants
Marketing
Research & Development
Strategy
Sales
Find the fact
Tell the story
Win the pitch
Understand the market
Develop your strategy
Academia
Agencies
Consultancies
Consumer goods
Finance
Tech
Research solutions
Strategy consulting
Communication services
Explore Statista+
Statista R
Statista Healthcare
About Statista
First steps & help center
Webinar & training hub
Success stories
Individuals & Small Teams
Businesses & Enterprises
Academia & Government
English
Deutsch
Daily Data
Global stories vividly visualized
Mar 28, 2014
This chart illustrates how many people use social networks to get news.
More Information
Mar 28, 2014
This chart shows global connected device shipments broken down by operating system.
More Information
Mar 27, 2014
This chart shows how global digital music revenues have grown between 2008 and 2013.
More Information
Mar 26, 2014
This chart shows the value of selected tech company acquisitions (in billion U.S. dollars).
More Information
Mar 26, 2014
This chart shows the motivation behind brands' use of Twitter as a marketing tool.
More Information
Mar 26, 2014
This chart shows the proportion of people aged 18-29 living with their parents in selected EU countries.
More Information
Mar 26, 2014
This chart illustrates that Android users are still slower to upgrade the operating system of their devices to the most recent version.
More Information
Mar 25, 2014
This chart shows the suggested retail price for a PlayStation 4 in selected countries in 2014.
More Information
Mar 25, 2014
This chart illustrates if and when Americans use mobile apps to follow March Madness during the workday. According to <a href="http://www.soasta.com/press-releases/march-madness-mobile-madness-51-march-madness-fans-plan-follow-tournament-work-using-mobile-apps/">Soasta</a>...
More Information
Mar 25, 2014
This chart shows global mobile advertising revenues from 2012 to 2014.
More Information
Mar 25, 2014
This chart shows the top ten EU28 cargo ports in 2012.
More Information
Mar 25, 2014
This chart shows total airline complaints per 100,000 emplanements in the U.S. in 2013.
More Information
Mar 23, 2014
This chart shows the results of a Socialbakers survey among 500+ marketers regarding their company’s adoption of social networks as...
More Information
Mar 23, 2014
This chart shows average app prices in 2013.
More Information
Mar 20, 2014
This chart shows smuggled cigarettes as a percentage of total cigarette consumption in top U.S. states in 2012
More Information
Mar 20, 2014
This chart shows global music revenue by category.
More Information
Mar 20, 2014
This chart shows that brands shouldn’t overdo it with hashtags when they post something on Facebook.
More Information
Mar 19, 2014
This chart shows bonuses paid to New York City workers in the financial securities industry.
More Information
Mar 19, 2014
This chart illustrates the impressive growth of digital music revenues over the past decade.
More Information
Mar 19, 2014
This chart shows engagement metrics for visitors of newspaper websites coming from different sources.
More Information
Mar 18, 2014
This chart shows the percentage of small businesses using the following in 2013.
More Information
Mar 18, 2014
This chart shows the search area for missing MH370 in perspective (size in square kilometres).
More Information
Mar 18, 2014
This chart illustrates the declining organic reach of brands' Facebook posts.
More Information
Mar 18, 2014
This chart shows the percentage of the population that smoked in U.S. states in 2013.
More Information
Mar 17, 2014
This chart shows worldwide TV shipments from 2009 to 2013.
More Information
Mar 17, 2014
This chart shows the year-over-year growth of active app users in China, broken down by app category.
More Information
Mar 17, 2014
This chart shows thefts per 100,000 registered vehicles in 2012.
More Information
Mar 16, 2014
This chart shows brand retention among smartphone manufacturers in 2013.
More Information
Mar 14, 2014
This chart shows the percentage of American adults who use th internet from 1995 to 2014.
More Information
Mar 14, 2014
This chart gives an overview of St. Patricks Day in the United States.
More Information
Mar 13, 2014
This chart shows the average time millennials in the U.S. spend interacting with media per day.
More Information
Mar 13, 2014
This chart shows iPhone sales from fiscal year 2011 through fiscal year 2015, broken down by the type of purchase.
More Information
Mar 13, 2014
This chart shows the percentage of people in the U.S. who used the following streaming services in the past month by age.
More Information
Mar 13, 2014
This chart shops trends in papal favourability among U.S. Catholics
More Information
Mar 12, 2014
This chart breaks down Apple's estimated gross profit for fiscal year 2014 by product category.
More Information
Mar 12, 2014
This chart shows historical active duty U.S. Army personnel and proposed Obama administration cuts.
More Information
Mar 11, 2014
This chart illustrates how universal the reach of companies such as Google, Facebook or Yahoo is in the mobile web.
More Information
Mar 11, 2014
This chart shows key facts on female-owned firms in the United States
More Information
Mar 11, 2014
This chart shows the percentage of Democrats and Republicans favoring gay marriage.
More Information
Mar 10, 2014
This chart shows the results of a survey on music streaming adoption in the United States.
More Information
Mar 10, 2014
This chart shows trends that will transform your business over the next five years, according to CEOs, in percent.
More Information
Mar 7, 2014
This chart shows the most important factors in the purchasing process of a new mobile phone. According to a <a href="http://www.nielsen.com/us/en/newswire/2014/the-female-male-digital-divide.html">global...
More Information
Mar 5, 2014
This chart shows the highest paying companies for interns in the United States in 2014.
More Information
Mar 4, 2014
This chart illustrates which countries have contributed most to Kickstarter reaching $1 billion in pledges by early March 2014. Backers...
More Information
Mar 4, 2014
This chart shows a forecast of 2014 smartphone market share.
More Information
Mar 3, 2014
This chart shows worldwide tablet sales in 2012 and 2013, broken down by operating system.
More Information
Mar 3, 2014
This chart shows the estimated military strength of Russia and Ukraine in 2014.
More Information
Feb 27, 2014
This chart shows nominations and wins by individuals at the Academy Awards.
More Information
Feb 27, 2014
This chart shows which technologies Americans wouldn't want to give up. A couple of years ago, <a href="/topics/977/television/">television</a>...
More Information
Feb 21, 2014
This chart shows how much an average user uses WhatsApp per month.
More Information
Feb 20, 2014
This chart shows the U.S. states with the most millionaires.
More Information
Feb 20, 2014
This chart compares how highly users of different social networks / messaging services are valued.
More Information
Feb 20, 2014
This chart compares Facebook's acquisition of WhatsApp with other high-profile tech takeovers.
More Information
Feb 20, 2014
This chart shows bonuses per gold medal at the Winter Olympics in Sochi (in U.S. dollars).
More Information
Feb 19, 2014
This chart illustrates WhatsApp's impressive user growth. The messaging app reached 430 million active users in January 2014, up from...
More Information
Feb 19, 2014
This chart shows the initial goal, total raised and number of backers in the most successful Kickstarter campaigns.
More Information
Feb 19, 2014
This infographic show key facts and statistics on energy drinks in the United States. Sales, distribution channel and other interesting...
More Information
Feb 19, 2014
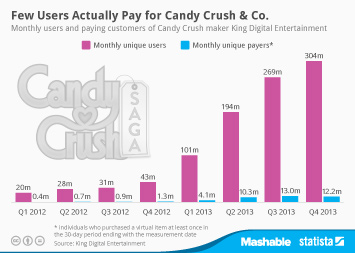
This chart shows how few of King's 300 million users actually spend money on the company's online and mobile games.
More Information
Feb 18, 2014
This chart shows how many U.S. internet users in a committed relationship share an email account, a social networking profile or their...
More Information
Feb 18, 2014
This chart shows the net appreciation of selected tech executives' company stockholdings in 2013.
More Information
Feb 18, 2014
This infographic illustrates key facts about food retail in the United States.
More Information
Feb 17, 2014
This chart shows hospital beds per 1000 people in selected countries.
More Information
Feb 17, 2014
This chart shows how internet adoption in the United States compares to the adoption rates in other countries. China for example lags...
More Information
Feb 17, 2014
This chart shows Facebook's referral traffic as a percentage of publishers' total traffic. In January 2014, 16.2% of the sampled publishers'...
More Information
Feb 16, 2014
This chart illustrates the results of a survey on the social acceptance of homosexuality in different countries.
More Information
Feb 14, 2014
This chart provides an overview of Valentine’s Day in the United States.
More Information
Feb 13, 2014
This chart shows market share figures for smartphone operating systems.
More Information
Feb 13, 2014
This chart shows the average age and annual pay rate of new business founders worldwide in 2013
More Information
Feb 12, 2014
This chart shows new franchise units added in the United States between July 2012 and July 2013.
More Information
Feb 12, 2014
This chart shows illegal immigrant removals in the United States from 2002 to 2013.
More Information
Feb 12, 2014
This chart shows how long Americans are using Facebook and Twitter on different platforms.
More Information
Feb 11, 2014
This chart shows VC funds closed and capital raised over the past 10 years.
More Information
Feb 11, 2014
This chart shows the top 10 most generous donors in the United States in 2013.
More Information
Feb 10, 2014
Percentage of U.S. adults who could not live without the following things.
More Information
Feb 10, 2014
This chart shows attacks by terrorists, insurgents and non-state armed groups in 2013
More Information
Feb 10, 2014
This chart shows the share of acceptance/unacceptance of the following in Russia.
More Information
Feb 7, 2014
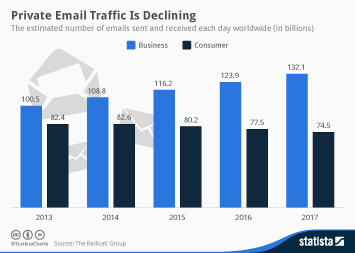
This chart shows the estimated number of emails sent and received each day worldwide.
More Information
Feb 7, 2014
This chart shows the number of tech startups founded in selected cities in 2012/2013.
More Information
Feb 6, 2014
This chart shows the all-time medal count of the most successful nations at the Winter Olympics since 1924.
More Information
Feb 6, 2014
This chart shows the biggest gambling losses by country in 2013.
More Information
Feb 6, 2014
This chart shows the original and actual estimated costs of 2014 Winter Olympic venues.
More Information
Feb 6, 2014
This graphic shows Twitters revenue and losses from 2013.
More Information
Feb 5, 2014
This graphic shows the number of daily searches on DuckDuckGo.com.
More Information
Feb 5, 2014
This chart shows the number of places pledged to Syrian refugees as of January 2014.
More Information
Feb 4, 2014
This chart shows the percentage of male/female Facebook users who cite the following as "major reasons" why they use Facebook.
More Information
Feb 4, 2014
The chart shows the top 10 companies by the number of security vulnerabilities in 2013.
More Information
Feb 4, 2014
Are you personally affected by corruption in daily life?
More Information
Feb 3, 2014
This chart shows a forecast of the B2C ecommerce sales growth 2014 in selected countries.
More Information
Feb 2, 2014
This chart shows the proportion of people estimated to be aged 65 and older in 2010 and 2050.
More Information
Feb 2, 2014
This chart shows the global market share of Windows 7 and 8 since their releases.
More Information
152
/
161
Contact
Get in touch with us. We are happy to help.
Do you still have questions?
Feel free to contact us anytime using our
contact form
or visit our
FAQ page
.
Your contact to the Infographics Newsroom
Felix Richter
Data Journalist
felix.richter@statista.com
+49 (40) 284 841 557