Skip to main content
Consumer Goods & FMCG
E-Commerce
Economy & Politics
Energy & Environment
Health, Pharma & Medtech
Internet
Media
Technology & Telecommunications
Transportation & Logistics
Travel, Tourism & Hospitality
View all industries
Global data volume growth
Global AI market size
Number of generative AI users worldwide
Global inflation rate
Retail e-commerce sales worldwide
Largest economies worldwide
Biggest social media platforms by users
Global EV market share by manufacturer
International tourist arrivals by world region
Global annual CO₂ emissions
Browse recent statistics
Artificial intelligence (AI) worldwide
TikTok
Nvidia
E-commerce worldwide
Global GDP
Instagram
Apparel market worldwide
Video gaming worldwide
Global renewable energy industry
Influencer marketing worldwide
Browse recent topics
Consumer Trends 2026
Artificial Intelligence: in-depth market analysis
E-commerce challenges
Global economy
TikTok
Luxury goods: in-depth market analysis
Electric vehicles: A global overview
Video gaming worldwide
Travel and tourism trends 2026
Battery recycling worldwide
Browse recent reports
Explore the tool
Explore Classic mode
Advertising & Media
eCommerce
Consumer
Finance
Global Indicators
Health
Industrial
Mobility
Technology
Explore Market Insights
eCommerce Insights
Research AI
Book a demo
All integrations
Developer docs
Explore Statista Connect
Research
Strategy & Consulting
Marketing
Media & PR
Explore AI assistants
Marketing
Research & Development
Strategy
Sales
Find the fact
Tell the story
Win the pitch
Understand the market
Develop your strategy
Academia
Agencies
Consultancies
Consumer goods
Finance
Tech
Research solutions
Strategy consulting
Communication services
Explore Statista+
Statista R
Statista Healthcare
About Statista
First steps & help center
Webinar & training hub
Success stories
Individuals & Small Teams
Businesses & Enterprises
Academia & Government
English
Deutsch
Daily Data
Infographics on the topic "smartphones"
Mar 26, 2014
This chart illustrates that Android users are still slower to upgrade the operating system of their devices to the most recent version.
More Information
Mar 16, 2014
This chart shows brand retention among smartphone manufacturers in 2013.
More Information
Mar 13, 2014
This chart shows iPhone sales from fiscal year 2011 through fiscal year 2015, broken down by the type of purchase.
More Information
Mar 11, 2014
This chart illustrates how universal the reach of companies such as Google, Facebook or Yahoo is in the mobile web.
More Information
Mar 7, 2014
This chart shows the most important factors in the purchasing process of a new mobile phone. According to a <a href="http://www.nielsen.com/us/en/newswire/2014/the-female-male-digital-divide.html">global...
More Information
Mar 4, 2014
This chart shows a forecast of 2014 smartphone market share.
More Information
Feb 27, 2014
This chart shows which technologies Americans wouldn't want to give up. A couple of years ago, <a href="/topics/977/television/">television</a>...
More Information
Feb 13, 2014
This chart shows market share figures for smartphone operating systems.
More Information
Feb 12, 2014
This chart shows how long Americans are using Facebook and Twitter on different platforms.
More Information
Feb 10, 2014
Percentage of U.S. adults who could not live without the following things.
More Information
Jan 28, 2014
This chart illustrates how Apple’s growth has all but disappeared in the past few quarters.
More Information
Jan 28, 2014
This chart shows how many smartphones the world's largest smartphone vendors shipped in 2012 and 2013.
More Information
Jan 23, 2014
This chart shows the percentage of U.S. smartphone users with some sort of alert in these categories.
More Information
Jan 14, 2014
This chart illustrates how much app usage has increased over the past 12 months.
More Information
Jan 10, 2014
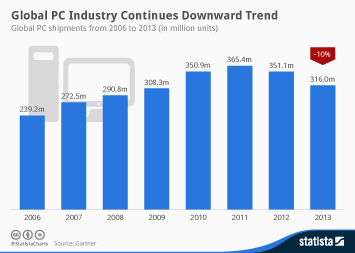
This chart shows global PC shipments from 2006 through 2013. In 2013, 316 million PCs were shipped worldwide, a 10 percent decline...
More Information
Jan 2, 2014
This chart illustrates how many Americans have had accidents related to on-the-go cell phone usage.
More Information
Nov 27, 2013
The global smartphone market continues to grow. One of the biggest drivers behind future growth will be the continous decline of the...
More Information
Nov 22, 2013
Mobile internet access continues to become more and more common across the globe. Ericsson predicts that the number of mobile internet...
More Information
Nov 18, 2013
Despite its average selling price dropping from $675 in Q3 2012 to $635 in this year's September quarter, Apple's iPhone continues...
More Information
Nov 14, 2013
Mobile phone users from the Asia-Pacific region consume the most data. Driven by entertainment applications such as YouTube, Youku...
More Information
Nov 8, 2013
This chart shows the revenue development of selected smartphone companies.
More Information
Oct 30, 2013
This chart shows the quarterly profits of Samsung and Apple. Samsung managed to turn a larger profit than Apple in two consecutive...
More Information
Oct 29, 2013
Apple sold 33.8 million iPhones between June 30 and September 28 this year, rounding off the company's fiscal year with a new sales...
More Information
Oct 11, 2013
This chart shows how much people from selected OECD nations talk on their mobile phones per month.
More Information
Oct 2, 2013
Windows Phone isn't quite dead yet. Devices equipped with Microsoft's smartphone operating system accounted for almost ten percent...
More Information
Mobile Apps
Oct 1, 2013
Despite Android's dominant position in the global smartphone market, businesses around the world still consider iOS the most important...
More Information
Sep 30, 2013
Online radio is growing increasingly popular in the United States. More than half of internet users aged 12 or older listen to one...
More Information
Sep 20, 2013
Video streaming services are becoming increasingly popular in the United States. Tired of linear TV programming, many Americans turn...
More Information
Sep 17, 2013
The United States is by far the largest LTE market in the world. By March 2013, 47 million Americans were 4G subscribers, which, at...
More Information
Sep 12, 2013
This chart shows a forecast of global connected device shipments. Market research group IDC expects smartphone shipments to reach one...
More Information
Sep 9, 2013
According to eMarketer, approximately 121 million smartphone users lived in the U.S. in 2012. In 2014, analysts are predicting a rise...
More Information
Sep 5, 2013
Korean smartphone users can't get enough apps on their smartphones. With an average number of 40 apps per smartphone user, South Korea...
More Information
Sep 4, 2013
This chart shows smartphone platform market share figures for the United States, China and the EU5 countries (UK, Germany, France,...
More Information
Sep 3, 2013
Microsoft and Nokia are both losing in the smartphone market. Now Microsoft has acquired Nokia's devices business. Will two wrongs...
More Information
Aug 30, 2013
M-Commerce sales in the United States amounted to $10.6 billion in the first half of 2013. Given the traditionally strong holiday quarter,...
More Information
Aug 29, 2013
This chart shows the current trade-in value of popular Smartphones in the United States. According to trade-in service Gazelle, a used...
More Information
Aug 23, 2013
55 percent of Android smartphones sold in the United States in Q2 2013 were equipped with screens larger than 4.5 inches in diagonal....
More Information
Aug 20, 2013
Mobile phones now account for almost a fifth of global web usage, as smartphones have become ubiquitous in many parts of the world.
More Information
Aug 15, 2013
This chart shows global smartphone operating system market share, based on unit sales to end users in the second quarter of 2013.
More Information
Aug 13, 2013
This chart illustrates global mobile phone sales from the first quarter of 2010 through the second quarter of 2013.
More Information
Aug 12, 2013
This chart shows smartphone manufacturer market share in the United States for the second quarter of 2013.
More Information
Jul 26, 2013
This chart shows the number of smartphones shipped by the Top 5 smartphone vendors in the second quarter of 2013.
More Information
Jul 25, 2013
This chart shows Facebook's revenue by segment.
More Information
Jul 22, 2013
This Chart shows the global share of Apple and Samsung mobile webpage views via smartphone.
More Information
Jul 11, 2013
This chart shows second quarter PC shipments by the world's largest PC manufacturers.
More Information
Jul 8, 2013
This chart shows the percentage change in stock prices of the world's leading smartphone vendors.
More Information
Jul 5, 2013
This chart illustrates the year-over-year of Samsung's operating profit.
More Information
Jun 26, 2013
This chart shows the ten fastest growing ad spenders among the Top 100 advertisers in the United States in 2012.
More Information
Jun 24, 2013
This chart shows the percentage of the population that accesses online news by smartphone and tablet in selected countries.
More Information
Jun 14, 2013
This chart shows what kind of devices Americans prefer to stream music on.
More Information
Jun 13, 2013
This chart shows computer and video game sales in the United States from 2009 through 2012, both on a unit and dollar basis.
More Information
May 28, 2013
This chart illustrates global search interest in high-end smartphones from January through May 2013.
More Information
May 22, 2013
This chart illustrates how gaming consoles are used in the United States.
More Information
May 15, 2013
This chart illustrates worldwide smartphone operating system market share from Q1 2010 through Q1 2013. All figures are based on unit...
More Information
May 13, 2013
This chart shows eBook sales as a percentage of trade publishers' net revenue in the United States.
More Information
May 8, 2013
This chart shows the percentage of web traffic coming from mobile devices in 2010 and 2013.
More Information
Apr 29, 2013
This chart shows the number of smartphones shipped by the Top 5 vendors in the first quarter of 2013.
More Information
Apr 11, 2013
This chart shows worldwide PC shipments by the Top 5 vendors in the first quarter of 2013.
More Information
Apr 10, 2013
This chart illustrates funds raised through crowdfunding in different regions during 2012.
More Information
Apr 5, 2013
This chart illustrates how Facebook users in the United States are shifting their use of the service from PCs to smartphones, while...
More Information
Apr 3, 2013
This chart shows a worldwide IT spending forecast. Global IT spending is expected to reach $3.8 trillion in 2013.
More Information
Apr 2, 2013
This chart shows the digital share of recorded music sales in the world's largest music markets.
More Information
Mar 27, 2013
This chart shows a forecast of global smartphone, tablet and PC shipments from 2012 through 2017.
More Information
Mar 26, 2013
This chart illustrates how mobile internet traffic is growing even quicker than fixed-line internet traffic did back in the 1990s and...
More Information
Mar 19, 2013
The chart shows iPhone and Samsung Galaxy sales in comparison.
More Information
Mar 18, 2013
The chart shows the number of U.S. Mobile, Online Casual and Social Gamers 2010 - 2014 .
More Information
Mar 12, 2013
This chart shows the percentage of monthly pageviews coming from mobile devices. In February 2013, tablets have surpassed smartphones...
More Information
Mar 11, 2013
This chart shows the 2012 market share of China's top five smartphone vendors.
More Information
Mar 6, 2013
This chart provides a breakdown of global mobile phone shipments from 2012 through 2017, by device type.
More Information
Mar 5, 2013
This chart shows ranks the top six smartphone markets, based on their share of global unit shipments.
More Information
Mar 4, 2013
This chart shows a shipment forecast for smartphones with 4.6 to 6.5-inch screens.
More Information
Feb 26, 2013
This chart shows global sales of the best-selling video game home consoles of all time.
More Information
Feb 25, 2013
This chart shows global shipments of smart connected devices in 2011 and 2012. Tablet and smartphone shipments continued to grow in...
More Information
Feb 21, 2013
This chart shows the percentage of mobile phone owners using a prepaid plan in selected countries.
More Information
Feb 21, 2013
This chart shows the share of consumer technology revenues grabbed by the top 5 vendors in the United States.
More Information
Feb 19, 2013
This chart shows consumer spending on video games in the United States in 2011 and 2012.
More Information
Feb 15, 2013
This chart shows the percentage of retail e-commerce dollars spent via mobile devices in the United States.
More Information
Feb 13, 2013
This chart shows smartphone operating system market share in Q4 2012, based on unit sales to end users. In the quarter ended December...
More Information
Jan 30, 2013
This chart shows RIM's BlackBerry smartphone shipments from March 4, 2007 to December 1, 2012.
More Information
Jan 29, 2013
This chart shows the number of smartphones shipped by the Top 5 vendors in the fourth quarter of 2012.
More Information
Jan 22, 2013
This chart shows the number of smartphones shipped by Apple and Samsung from Q4 2009 through Q3 2012.
More Information
Jan 9, 2013
The chart shows the percentage of U.S. consumers, who are likely to buy the following products in 2013.
More Information
Jan 3, 2013
The chart shows the estimated number of app downloads from Dec 25 to Dec 31.
More Information
Dec 31, 2012
This chart shows a shipment forecast for smartphones with 4.6 to 6.5-inch screens.
More Information
7
/
8
Contact
Get in touch with us. We are happy to help.
Do you still have questions?
Feel free to contact us anytime using our
contact form
or visit our
FAQ page
.
Your contact to the Infographics Newsroom
Felix Richter
Data Journalist
felix.richter@statista.com
+49 (40) 284 841 557