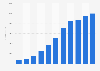
This statistic shows Tmall user distribution in China as of March 2018, by city tier. During the surveyed period, approximately 33 percent of e-commerce platform Tmall users were from the fourth and lower tier cities in China.
Tmall user distribution in China as of March 2018, by city tier
Basic Account
Get to know the platform
You only have access to basic statistics.
This statistic is not included in your account.
Starter Account
The ideal entry-level account for individual users
- Instant access to 1m statistics
- Download in XLS, PDF & PNG format
- Detailed references
$199 USD / Month *
Professional Account
Full access
Business Solutions including all features.
* Prices do not include sales tax.
Other statistics that may interest you Statistics on
About the industry
10
- Premium Statistic Share of Pinduoduo users in China 2022, by gender
- Premium Statistic Share of Pinduoduo users in China 2020, by city tier
- Basic Statistic E-commerce as share of total retail in Latin America 2022, by country
- Premium Statistic Amazon: monthly number of new third party sellers in the UK 2017-2020
- Premium Statistic Peru: product categories with biggest search lift COVID-19 2020
- Basic Statistic Impact of coronavirus on different online delivery options in the UK 2020
- Premium Statistic Amazon: share of Prime-enabled sellers in the UK 2016-2019
- Premium Statistic Amazon: share of Prime-enabled sellers in Europe 2016 - 2019
- Premium Statistic United Kingdom (UK): top ten e-shops on Twitter 2020, by follower number
- Premium Statistic Brazil: shipping cost per online order 2017-2019
About the region
10
- Premium Statistic Most popular retail e-commerce categories in China 2014
- Premium Statistic Leading B2C e-commerce retailers in China 2012, by monthly order growth
- Premium Statistic Fresh food e-commerce GMV in China 2013-2024
- Premium Statistic Fresh food e-commerce GMV growth in China 2014-2023
- Premium Statistic Number of active shoppers on Singles' Day in China 2023, by e-commerce platform
- Premium Statistic Number of monthly active users of fresh commerce in China 2022, by platform
- Premium Statistic JD.com's revenue share of self-operated business 2017-2022
- Premium Statistic JD.com's revenue from self-operated business 2015-2022
- Premium Statistic Fresh food online market concentration rate in China 2018-2020
- Premium Statistic Growth of income from self-operated business of JD.com 2013-2016
Selected statistics
4
- Basic Statistic Consumer electronics: Online purchasing in Great Britain 2020, by demographic
- Premium Statistic India: leading e-commerce categories 2013, by sales
- Premium Statistic Where consumers shop for clothing and footwear in the United Kingdom (UK) 2013
- Premium Statistic Channels consumers use for their main grocery shop in the United Kingdom (UK) 2013
Other regions
10
- Premium Statistic Share of Canadians that shopped online and offline 2021, by generation
- Basic Statistic eBay: global seller location 2020, by country
- Premium Statistic Share of consumers who prefer Finnish online shops after the COVID-19 outbreak 2020
- Premium Statistic Brazil: top e-commerce categories by Net Promoter Score 2019
- Premium Statistic U.S. generations shopping online and offline 2021
- Premium Statistic Payment cards used for purchasing online in Denmark 2020
- Premium Statistic Distribution of e-commerce exports from Bangladesh 2017, by type
- Premium Statistic Number of active buyers on Alibaba in Nepal 2015-2017
- Premium Statistic Number of active buyers on Alibaba in Myanmar 2015-2017
- Premium Statistic Number of active buyers on Alibaba in Cambodia 2015-2017
Related statistics
10
- Premium Statistic Number of active shoppers on Singles' Day in China 2017-2018, by e-commerce platform
- Premium Statistic Monthly usage of B2C e-commerce retailers in China in 2011
- Premium Statistic Conversion rate of selected B2C e-commerce retailers in China 2011
- Premium Statistic Leading B2C e-commerce retailers in China 2010-2011, ranked by order growth rate
- Premium Statistic Transaction value of second-hand e-commerce in China 2015-2022
- Premium Statistic Transaction value growth of China's online retail market 2012-2022
- Premium Statistic E-commerce market GMV in China 2012-2022
- Premium Statistic Xiaohongshu's active user age breakdown 2023
- Premium Statistic Xiaohongshu's active user gender breakdown 2023
- Premium Statistic Leading online marketplaces in China 2023, by monthly visits
Further related statistics
7
- Leading online retailers in Southeast Asia 2020, by monthly visits
- Unique visitors to most popular online retailers in India 2014
- Travel arrangements: Online purchasing in Great Britain 2019, by demographic
- Prepaid debit card use in U.S. households 2013-2019, by tenure
- Computer software: Online purchasing in Great Britain 2020, by age group
- Use of smartphones by shoppers in retail stores in Italy in 2015
- Furniture shopping: Consumers' delivery preferences in the United Kingdom (UK) 2013
Further Content: You might find this interesting as well
Statistics
- Leading online retailers in Southeast Asia 2020, by monthly visits
- Unique visitors to most popular online retailers in India 2014
- Travel arrangements: Online purchasing in Great Britain 2019, by demographic
- Prepaid debit card use in U.S. households 2013-2019, by tenure
- Computer software: Online purchasing in Great Britain 2020, by age group
- Use of smartphones by shoppers in retail stores in Italy in 2015
- Furniture shopping: Consumers' delivery preferences in the United Kingdom (UK) 2013
Website (chinainfluencermarketing.com). (October 18, 2018). Tmall user distribution in China as of March 2018, by city tier [Graph]. In Statista. Retrieved April 19, 2024, from https://www.statista.com/statistics/1007074/china-tmall-user-breakdown-by-city-tier/
Website (chinainfluencermarketing.com). "Tmall user distribution in China as of March 2018, by city tier." Chart. October 18, 2018. Statista. Accessed April 19, 2024. https://www.statista.com/statistics/1007074/china-tmall-user-breakdown-by-city-tier/
Website (chinainfluencermarketing.com). (2018). Tmall user distribution in China as of March 2018, by city tier. Statista. Statista Inc.. Accessed: April 19, 2024. https://www.statista.com/statistics/1007074/china-tmall-user-breakdown-by-city-tier/
Website (chinainfluencermarketing.com). "Tmall User Distribution in China as of March 2018, by City Tier." Statista, Statista Inc., 18 Oct 2018, https://www.statista.com/statistics/1007074/china-tmall-user-breakdown-by-city-tier/
Website (chinainfluencermarketing.com), Tmall user distribution in China as of March 2018, by city tier Statista, https://www.statista.com/statistics/1007074/china-tmall-user-breakdown-by-city-tier/ (last visited April 19, 2024)
Tmall user distribution in China as of March 2018, by city tier [Graph], Website (chinainfluencermarketing.com), October 18, 2018. [Online]. Available: https://www.statista.com/statistics/1007074/china-tmall-user-breakdown-by-city-tier/