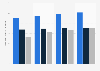
According to a survey conducted among consumers in the United States in January 2023, BeReal was the social media app seeing the highest growth in approval during the previous 90 days, approximately 23 percentage points. TextNow and Life360 followed, with an improvement of around 22 percentage points and 18 percentage points, respectively. In comparison, social video app TikTok and Truth Social saw a decrease in approval of 25.4 percentage points and 22.2 percentage points, respectively.
Increase in personal positive opinion on social media and communication apps among consumers in the United States in January 2023
Basic Account
Get to know the platform
You only have access to basic statistics.
This statistic is not included in your account.
Starter Account
The ideal entry-level account for individual users
- Instant access to 1m statistics
- Download in XLS, PDF & PNG format
- Detailed references
$199 USD / Month *
Professional Account
Full access
Business Solutions including all features.
* Prices do not include sales tax.
Other statistics that may interest you Statistics on
About the industry
10
- Premium Statistic TikTok usage in the U.S. 2023, by age
- Premium Statistic Leading iPhone social media apps in France 2022, by downloads
- Premium Statistic Leading social media services and apps in Poland 2020, by user numbers
- Premium Statistic Most popular apps using QR codes Vietnam 2019
- Premium Statistic Leading Android social media apps in the Netherlands 2022, by revenue
- Premium Statistic Leading Android social media apps worldwide 2022, by downloads
- Premium Statistic Leading non-gaming iPad app publishers in Germany 2022, by downloads
- Premium Statistic Leading non-gaming iPad app publishers in Great Britain 2022, by downloads
- Premium Statistic Leading Android social media apps in Sweden 2022, by downloads
- Premium Statistic Leading iPhone social media apps in Sweden 2022, by downloads
About the region
10
- Basic Statistic United States: leading messenger app penetration 2020
- Premium Statistic Average monthly smartphone unlock session per unique user U.S. 2019, by vertical
- Basic Statistic Unlock engagement ratio of leading mobile apps in the U.S. 2018
- Basic Statistic Length of unlock sessions among U.S. smartphone users 2018
- Premium Statistic Distribution of push notifications among U.S. smartphone users 2018
- Premium Statistic Americans who used camera or photo editing apps in 2023, by income
- Premium Statistic Americans who rented a car online in 2022, by income
- Premium Statistic Americans: share who used mobile payments 2022, by income
- Basic Statistic U.S. Instagram users 2024, by gender
- Premium Statistic Amazon Appstore: growth of available apps Q3 2022, by category
Other regions
10
- Premium Statistic Leading Android social media apps in France 2022, by downloads
- Premium Statistic Mobile apps ranked by importance in Denmark 2020
- Basic Statistic Leading social media services during COVID-19 in Poland 2019-2020, by user numbers
- Premium Statistic YouTube usage purposes in Finland 2019
- Premium Statistic Frequently used features on Instagram by teenagers in Flanders (Belgium) 2017
- Premium Statistic Tinder: current and former usage in the UK 2017, by usage of dating site
- Premium Statistic Leading mobile apps considered important in Norway 2020, by gender
- Premium Statistic Leading non-gaming iPad app publishers in Switzerland 2021, by downloads
- Premium Statistic On demand app usage of millennials in Germany 2017
- Premium Statistic Peru: social media user share in Lima 2018, by platform
Related statistics
10
- Premium Statistic Leading mobile apps considered important in Denmark 2020, by gender
- Premium Statistic Mobile apps ranked by importance in Norway 2020
- Premium Statistic WhatsApp usage purposes in Finland 2019
- Premium Statistic LinkedIn usage purposes in Finland 2019
- Premium Statistic Instagram usage purposes in Finland 2019
- Premium Statistic Twitter usage purposes in Finland 2019
- Premium Statistic Leading Italian TikTok creators 2024, by number of followers
- Premium Statistic Leading iPad social media apps in Sweden 2022, by downloads
- Premium Statistic Leading iPhone social media apps worldwide 2022, by revenue
- Premium Statistic Leading non-gaming iPad app publishers in Belgium 2022, by downloads
Further related statistics
5
- Social network usage for news access worldwide 2019-2023
- Social network profile creation in the UK 2010-2020, by socio-economic group
- Leading trends in technology in restaurants in the U.S. 2015*
- Reasons for using social media to get a customer service response 2012
- Media influencing final decisions about politics in the U.S. in 2011
Further Content: You might find this interesting as well
Statistics
- Social network usage for news access worldwide 2019-2023
- Social network profile creation in the UK 2010-2020, by socio-economic group
- Leading trends in technology in restaurants in the U.S. 2015*
- Reasons for using social media to get a customer service response 2012
- Media influencing final decisions about politics in the U.S. in 2011
Digital Turbine. (February 1, 2023). Increase in personal positive opinion on social media and communication apps among consumers in the United States in January 2023 [Graph]. In Statista. Retrieved May 11, 2024, from https://www.statista.com/statistics/1373473/approval-growth-social-media-apps-us/
Digital Turbine. "Increase in personal positive opinion on social media and communication apps among consumers in the United States in January 2023." Chart. February 1, 2023. Statista. Accessed May 11, 2024. https://www.statista.com/statistics/1373473/approval-growth-social-media-apps-us/
Digital Turbine. (2023). Increase in personal positive opinion on social media and communication apps among consumers in the United States in January 2023. Statista. Statista Inc.. Accessed: May 11, 2024. https://www.statista.com/statistics/1373473/approval-growth-social-media-apps-us/
Digital Turbine. "Increase in Personal Positive Opinion on Social Media and Communication Apps among Consumers in The United States in January 2023." Statista, Statista Inc., 1 Feb 2023, https://www.statista.com/statistics/1373473/approval-growth-social-media-apps-us/
Digital Turbine, Increase in personal positive opinion on social media and communication apps among consumers in the United States in January 2023 Statista, https://www.statista.com/statistics/1373473/approval-growth-social-media-apps-us/ (last visited May 11, 2024)
Increase in personal positive opinion on social media and communication apps among consumers in the United States in January 2023 [Graph], Digital Turbine, February 1, 2023. [Online]. Available: https://www.statista.com/statistics/1373473/approval-growth-social-media-apps-us/