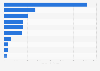
This statistic shows the annual growth of apparel sales in China from 2014 to 2019. In 2019, the sales of apparel in China increased by 5.2 percent compared to the previous year.
Annual growth rate of apparel sales in China from 2014 to 2019
Basic Account
Get to know the platform
You only have access to basic statistics.
This statistic is not included in your account.
Starter Account
The ideal entry-level account for individual users
- Instant access to 1m statistics
- Download in XLS, PDF & PNG format
- Detailed references
$199 USD / Month *
Professional Account
Full access
Business Solutions including all features.
* Prices do not include sales tax.
Other statistics that may interest you Statistics on
About the industry
10
- Premium Statistic Retail sales of apparel in China 2012-2026
- Premium Statistic Number of stores of fast fashion specialty retailer C&A in China 2010-2013
- Premium Statistic Number of stores of fast fashion specialty retailer H&M in China 2010-2013
- Premium Statistic Number of stores of fast fashion specialty retailer ZARA in China 2010-2013
- Basic Statistic Clothing and clothing accessories store sales in the United States 1992-2022
- Premium Statistic Clothing store sales in the United States from 1992-2022
- Premium Statistic Number of stores of fast fashion specialty retailers in China 2012
- Premium Statistic Family clothing store sales in the United States from 1992 to 2022
- Premium Statistic Women's clothing store sales in the United States from 1992 to 2022
- Premium Statistic Men's clothing store sales in the United States from 1992 to 2022
About the region
10
- Premium Statistic Store count of major fast fashion specialty retailers in China 2013
- Premium Statistic Number of stores of fast fashion specialty retailer UNIQLO in China 2010-2013
- Premium Statistic Number of the convenience stores in China 2015, by province number
- Premium Statistic Sales per square meter of medium sized supermarkets in China 2011-2012
- Premium Statistic Share of the convenience store operators going online in China 2015-2022
- Premium Statistic Leading convenience store operators in China 2022, based on number of stores
- Premium Statistic Sales revenue of convenience stores in China 2015-2025
- Premium Statistic Convenience store sales revenue growth in China 2016-2025
- Premium Statistic Leading department store operators in China 2022, based on revenues
- Premium Statistic Nominal retail sales growth in China 2020, by product category
Selected statistics
9
- Premium Statistic Footwear retail sales volume trend in Great Britain (UK) 2008-2022
- Basic Statistic John Lewis sales revenue in the United Kingdom (UK) 2009-2023
- Basic Statistic Victoria's Secret's net sales worldwide from 2010 to 2022
- Basic Statistic Number of Nike stores globally 2009-2023
- Premium Statistic John Lewis online sales growth in the United Kingdom (UK) 2011-2018
- Premium Statistic John Lewis online sales in the United Kingdom (UK) 2011-2016
- Basic Statistic John Lewis Partnership: number of employees in the United Kingdom (UK) 2009-2023
- Basic Statistic Nike's DTC revenue share worldwide 2011-2015
- Premium Statistic Where consumers shop for clothing and footwear in the United Kingdom (UK) 2013
Other regions
10
- Premium Statistic Household appliance store sales in the United States 1992-2023
- Basic Statistic Leading online grocery retailers in the United Kingdom (UK) 2015, by sales value
- Premium Statistic Forecast of retail sales growth in Western Europe 2008-2018
- Premium Statistic Forecast of retail sales growth in Singapore 2008-2018
- Premium Statistic Forecast of retail sales growth in the Middle East and North Africa 2008-2018
- Premium Statistic Retail sales growth in Hong Kong 2008-2018
- Premium Statistic Forecast of retail sales growth in Indonesia 2008-2018
- Premium Statistic Forecast of retail sales growth in Malaysia 2008-2018
- Basic Statistic World: share of leading 250 retailers 2021, by region
- Premium Statistic Monthly retail sales growth Thailand 2022-2023
Related statistics
10
- Premium Statistic Annual retail net profit margin in China 2013, by store type
- Premium Statistic New store openings of selected major foreign retailers in China 2011-2012
- Premium Statistic Market share of the leading 100 retail chain operators China 2002-2022
- Premium Statistic Total retail sales in Macao 2012-2022
- Premium Statistic Nominal retail sales growth rate in China 2022, by product category
- Premium Statistic Number of convenience stores in China 2015-2022
- Premium Statistic Daily sales revenue of convenience stores in China 2015-2022
- Premium Statistic Number of hypermarket outlets in Taiwan 2022, by retailer
- Premium Statistic Number of hypermarket outlets in Taiwan 2014-2019
- Premium Statistic Retail sales value of pasta and noodles in Taiwan 2015-2022
Further related statistics
8
- Forecast for Malaysia's retail sales 2008-2016
- Forecast of retail sales growth Philippines 2008-2018
- Tesco's sales worldwide 2016/2017-2022/2023, by region
- Electrical appliances retail sales volume index in Great Britain (UK) 2013-2023
- Most used lighting brands in the U.S. 2018
- Most used HVAC brands in the U.S. 2018
- Most used refrigerators brands in the U.S. 2015
- Flowers Foods: net income in the U.S. 2010-2022
Further Content: You might find this interesting as well
Statistics
- Forecast for Malaysia's retail sales 2008-2016
- Forecast of retail sales growth Philippines 2008-2018
- Tesco's sales worldwide 2016/2017-2022/2023, by region
- Electrical appliances retail sales volume index in Great Britain (UK) 2013-2023
- Most used lighting brands in the U.S. 2018
- Most used HVAC brands in the U.S. 2018
- Most used refrigerators brands in the U.S. 2015
- Flowers Foods: net income in the U.S. 2010-2022
Fung Business Intelligence Centre . (December 16, 2020). Annual growth rate of apparel sales in China from 2014 to 2019 [Graph]. In Statista. Retrieved April 19, 2024, from https://www.statista.com/statistics/656416/china-yoy-growth-rate-of-the-apparel-sales/
Fung Business Intelligence Centre . "Annual growth rate of apparel sales in China from 2014 to 2019." Chart. December 16, 2020. Statista. Accessed April 19, 2024. https://www.statista.com/statistics/656416/china-yoy-growth-rate-of-the-apparel-sales/
Fung Business Intelligence Centre . (2020). Annual growth rate of apparel sales in China from 2014 to 2019. Statista. Statista Inc.. Accessed: April 19, 2024. https://www.statista.com/statistics/656416/china-yoy-growth-rate-of-the-apparel-sales/
Fung Business Intelligence Centre . "Annual Growth Rate of Apparel Sales in China from 2014 to 2019." Statista, Statista Inc., 16 Dec 2020, https://www.statista.com/statistics/656416/china-yoy-growth-rate-of-the-apparel-sales/
Fung Business Intelligence Centre , Annual growth rate of apparel sales in China from 2014 to 2019 Statista, https://www.statista.com/statistics/656416/china-yoy-growth-rate-of-the-apparel-sales/ (last visited April 19, 2024)
Annual growth rate of apparel sales in China from 2014 to 2019 [Graph], Fung Business Intelligence Centre , December 16, 2020. [Online]. Available: https://www.statista.com/statistics/656416/china-yoy-growth-rate-of-the-apparel-sales/