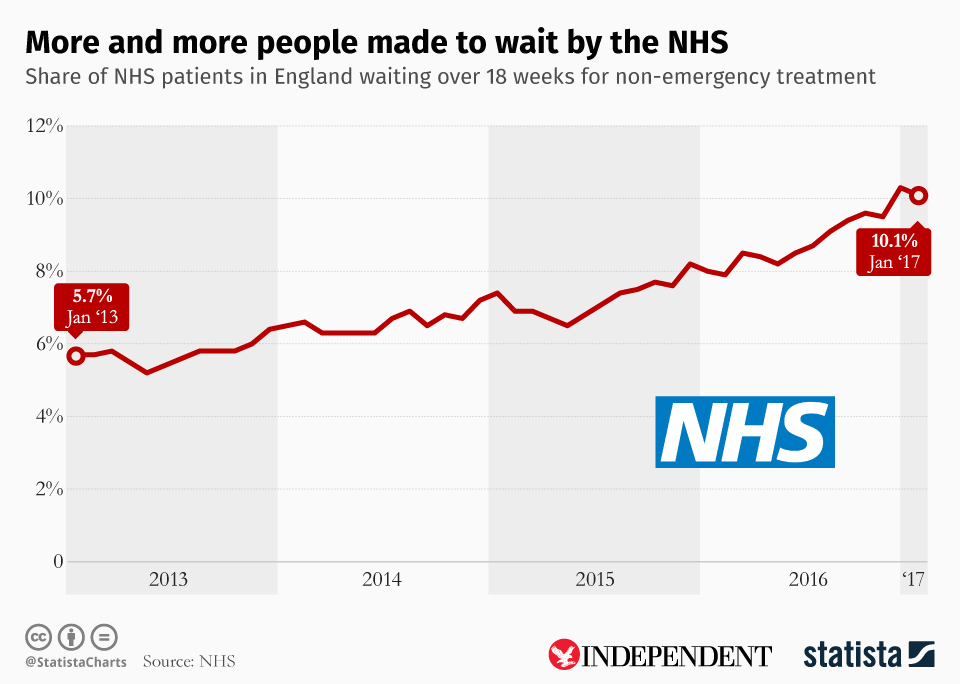
Since 2004, the NHS has maintained that no patient should wait longer than 18 weeks for an operation after a referral from their GP. The following infographic was recently featured on the Independent and it shows that the share of patients waiting longer than 18 weeks for surgery is creeping up. In 2013, 5.7 percent of patients had to wait longer than the 18 week target and at the start of this year, that increased to 10.1 percent. Read the full story about the effective abandonment of NHS waiting times on the Independent.
Advertisement
Advertisement
Advertisement
Related Infographics
FAQ
- The Statista "Chart of the Day", made available under the Creative Commons License CC BY-ND 3.0, may be used and displayed without charge by all commercial and non-commercial websites. Use is, however, only permitted with proper attribution to Statista. When publishing one of these graphics, please include a backlink to the respective infographic URL. More Information
- The Statista "Chart of the Day" currently focuses on two sectors: "Media and Technology", updated daily and featuring the latest statistics from the media, internet, telecommunications and consumer electronics industries; and "Economy and Society", which current data from the United States and around the world relating to economic and political issues as well as sports and entertainment.
- For individual content and infographics in your Corporate Design, please visit our agency website www.statista.design
Any more questions?
Get in touch with us quickly and easily.
We are happy to help!
Do you still have questions?
Feel free to contact us anytime using our contact form or visit our FAQ page.
Your contact to the Infographics Newsroom


Statista Content & Design
Need infographics, animated videos, presentations, data research or social media charts?
Advertisement