total consumption of bottled water in the UK to three billion liters in 2018, or the equivalent of approximately 1,200 Olympic swimming pools.
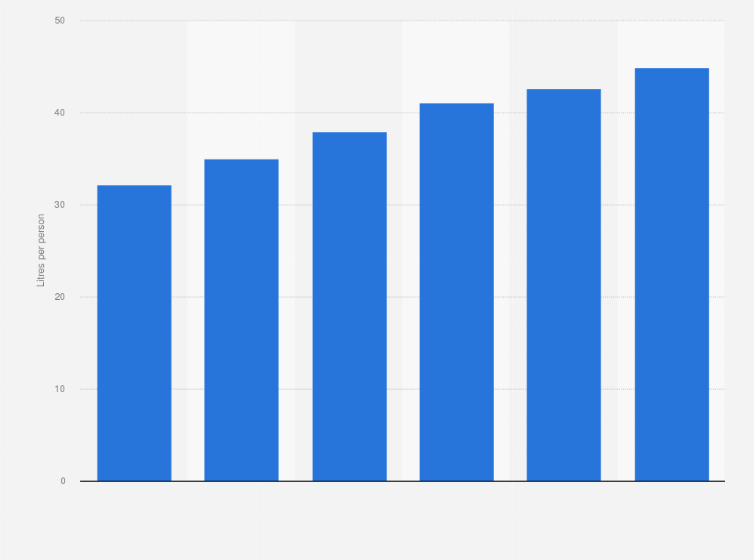
How much bottled water is consumed in the UK? In 2018, approximately 44.9 liters of bottled water was consumed per person in the United Kingdom. Bottled water consumption is up by 12.7 liters per person from 32.2 liters in 2013. This brings the Average consumption of bottled water per person in the United Kingdom from 2013 to 2018 (in liters)
Basic Account
Get to know the platform
You only have access to basic statistics.
This statistic is not included in your account.
Single Account
The ideal entry-level account for individual users
- Instant access to 1m statistics
- Download in XLS, PDF & PNG format
- Detailed references
$59 $39 / Month *
in the first 12 months
Corporate Account
Full access
Corporate solution including all features.
* Prices do not include sales tax.
Further Content: You might find this interesting as well
Statistics
- Packaged water total consumption in Austria 2008-2020
- Consumers' likelihood of choosing bottled water in the UK 2012, by gender
- Per capita consumption of mineral and carbonated water in Sweden 2009-2019
- Packaged water consumption per capita in Austria 2008-2020
- Consumption volume of mineral and carbonated water in Sweden 2009-2019
- Sales revenue of the leading bottled water companies in China 2014
- Packaged water total consumption in the United Kingdom (UK) 2007-2020
- Packaged water consumption in Germany 2010-2018
- Non-alcoholic beverage consumption worldwide 2011-2021
- Non-alcoholic beverage consumption: leading countries worldwide 2016
- Consumption volume of bottled water United Kingdom (UK) 1980-2010
- Bottled water consumption in Russia 2017-2019, by type
- Bottled water consumption share in Russia 2019, by federal district
- Forecast consumption of bottled water in the world's most consumed countries in 2020
- Level of comfort asking for water or top up for reusable water in the UK 2017-2018
- Mexico: production value of bottled water without gas 2016-2018
- Bottled water export & import prices in Russia in 2019
- Distribution of dishwashers in Australia 2021, by water consumption
British Soft Drinks Association. (July 18, 2019). Average consumption of bottled water per person in the United Kingdom from 2013 to 2018 (in liters) [Graph]. In Statista. Retrieved June 30, 2022, from https://www.statista.com/statistics/283766/bottled-water-consumption-per-person-in-the-united-kingdom-uk/
British Soft Drinks Association. "Average consumption of bottled water per person in the United Kingdom from 2013 to 2018 (in liters)." Chart. July 18, 2019. Statista. Accessed June 30, 2022. https://www.statista.com/statistics/283766/bottled-water-consumption-per-person-in-the-united-kingdom-uk/
British Soft Drinks Association. (2019). Average consumption of bottled water per person in the United Kingdom from 2013 to 2018 (in liters). Statista. Statista Inc.. Accessed: June 30, 2022. https://www.statista.com/statistics/283766/bottled-water-consumption-per-person-in-the-united-kingdom-uk/
British Soft Drinks Association. "Average Consumption of Bottled Water per Person in The United Kingdom from 2013 to 2018 (in Liters)." Statista, Statista Inc., 18 Jul 2019, https://www.statista.com/statistics/283766/bottled-water-consumption-per-person-in-the-united-kingdom-uk/
British Soft Drinks Association, Average consumption of bottled water per person in the United Kingdom from 2013 to 2018 (in liters) Statista, https://www.statista.com/statistics/283766/bottled-water-consumption-per-person-in-the-united-kingdom-uk/ (last visited June 30, 2022)