
- Internet›
- Reach & Traffic›
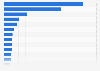
APAC: reach of most popular online categories 2014
Most popular online categories in Asia Pacific as of November 2014, by reach of internet audience

Percentage of internet users | |
---|---|
Corporate website | 98.4% |
Service | 98.2% |
Portal | 93.1% |
Entertainment | 91.2% |
Search/navigation | 90.2% |
Promotional server | 89.5% |
Mulitmedia | 87.3% |
Directories and resources | 80.3% |
Social media | 77.9% |
Downloads | 77.1% |
Percentage of internet users | |
---|---|
Corporate website | 98.4% |
Service | 98.2% |
Portal | 93.1% |
Entertainment | 91.2% |
Search/navigation | 90.2% |
Promotional server | 89.5% |
Mulitmedia | 87.3% |
Directories and resources | 80.3% |
Social media | 77.9% |
Downloads | 77.1% |
© Statista 2019
About this statistic
Show source
Please be patient - this may take a moment
Description
Source
More information
- Show sources information
- Show publisher information
- Release date
- March 2015
- Region
- APAC
- Survey time period
- November 2014
- Age group
- 15 years and older
- Special properties
- Online audiences from home and work locations, laptop and desktop only
- Region
- APAC
- Survey time period
- November 2014
- Age group
- 15 years and older
- Special properties
- Online audiences from home and work locations, laptop and desktop only


You only have access to basic statistics.
- Instant access to 1m statistics
- Download in XLS, PDF & PNG format
- Detailed references
$49 / Month *
Corporate solution including all features.
Prices do not include sales tax.


I think of Statista as Google for researchers. Statista provides you with the information you search for right away.Dr. Horst Stipp
EVP, Research & Innovation, Advertising Research Foundation
- Online audiences
- Countries with the highest number of internet users as of December 2017 (in millions)Countries with the highest number of internet users 2017
- Number of internet users in the Asia Pacific region as of January 2018, by country (in millions)Asia Pacific: number of internet users in selected countries 2018
- Countries with the biggest share of internet users in Asia as of June 2018, by countryDistribution of internet users in Asia 2018, by country
- Digital population in India as of January 2018 (in millions)India: digital population as of January 2018
- Number of internet users in India from 2015 to 2022 (in millions)India: number of internet users 2015-2022
- Total number of internet users in India from June 2012 to June 2016 (in millions)Number of internet users in India 2012-2016
- Percentage of population using the internet in India from 2000 to 2016India: internet penetration 2000-2016
- Fixed and mobile broadband internet subscription penetration in India from 2011 to 2016India: fixed and mobile broadband internet subscription reach 2011-2016
- Usage
- Internet access in urban India in 2016, by frequencyInternet access frequency in urban India 2016
- Internet access in rural India in 2016, by frequencyInternet access frequency in rural India 2016
- Accessing the internet in urban India in 2016, by reasonReasons to access the internet in urban India 2016
- Accessing the internet in rural India in 2016, by reasonReasons to access the internet in rural India 2016
- Average time spent online per week by rural users across India in 2016, by activity (in minutes)Average time spent online per week by rural users in India- by activity 2016
- Number of non-English digital entertainment users across India in 2016, by language (in millions)*Number of non-English digital entertainment users in India - by language 2016
- Number of non-English internet users across India in 2016, by activity (in millions)*Number of non-English internet users in India - by activity 2016
- Challenges faced by non-English internet users across India in 2016*Challenges faced by non-English internet users in India 2016
- Social media
- Average numbers of hours per day spent by social media users on all social media channels as of 4th quarter 2015, by countrySocial media: daily usage in selected countries as 4th quarter 2015
- Number of active mobile social media users in Asia Pacific from September 2017 to January 2018, by country (in millions)Active mobile social media users in APAC countries 2017-2018
- Active mobile social media penetration in selected Asia-Pacific countries as of January 2018Active mobile social media penetration in selected Asia-Pacific countries 2018
- Number of social network users in India from 2015 to 2022 (in millions)India: number of social network users 2015-2022
- Social network user penetration in India from 2015 to 2022India: social network penetration 2015-2022
- Penetration of leading social networks in India as of 3rd quarter 2017India: social network penetration Q3 2017
- Number of mobile phone messaging app users in India from 2015 to 2020 (in millions)India: number of mobile messaging users 2015-2020
- Selected emerging mobile markets with the highest WhatsApp penetration rate as of 3rd quarter 2017WhatsApp: popularity in emerging markets 2017
- Mobile internet
- Number of mobile phone internet users in India from 2015 to 2022 (in millions)India: mobile phone internet users 2015-2022
- Mobile phone internet user penetration in India from 2015 to 2022India: mobile phone internet user penetration 2015-2022
- Mobile phone internet user growth in India from 2016 to 2022India: mobile phone internet user growth 2016-2022
- Total number of mobile wireless subscribers in India from 2010 to 2017 (in millions)Total wireless subscribers in India 2010-2017
- Total number of mobile internet users in India from June 2012 to June 2016 (in millions)Number of mobile internet users in India 2012-2016
- Total number of mobile internet users in India from June 2012 to June 2016, by urbanity (in millions)Number of mobile internet users in India 2012-2016, by urbanity
- Most popular smartphone activities in India as of January 2018India: mobile activities as of January 2018
- Average number of monthly mobile minutes per visitor worldwide as of May 2017Global average number of monthly mobile minutes per visitor 2017
- E-commerce
- Leading online stores in India in 2017, ranked by net e-commerce sales (in million U.S. dollars)E-retailers: e-commerce sales in India 2017
- Online retail sales in India from 2009 to 2016 (in billion U.S. dollars)Online retail sales in India 2009-2016
- India: retail e-commerce revenue forecast from 2017 to 2023 (in billion U.S. dollars)Total retail e-commerce revenue in India 2017-2023
- Annual retail e-commerce sales growth in India from 2017 to 2022Retail e-commerce sales growth in India 2017-2022
- Digital travel sales in India from 2016 to 2021 (in billion U.S. dollars)India digital travel sales 2016-2021
- Average retail e-commerce revenue per user in India from 2017 to 2023 (in U.S. dollars)Retail e-commerce ARPU in India 2017-2023
- Number of online consumers across India in 2016 and 2017 (in millions)Number of online consumers in India 2016 - 2017
- Share of online sales in India in 2016, by categoryShare of online sales in India - by category 2016
- Japan: reach of most popular online categories 2015
- Reach of most popular online categories worldwide 2015
- U.S. reach of most popular online content categories 2016
- Convenience of using the internet according to respondents in the UK 2012
- Availability of information online according to respondents in the UK 2012
- Indonesia: internet user penetration 2015-2022
- Share of American internet users who visited Monster in the U.S. 2018, by age
- Internet usage in Eastern Europe
- Internet usage in Belgium
- Internet usage in the United Kingdom (UK)
- Internet usage worldwide
- Internet industry in Germany
- Internet usage in Russia
- Mobile internet usage in the European Union (EU)
- Internet usage in China
- Akamai - The State of the Internet Q4 2016
- Fixed broadband internet in Spain
- Internet usage in Italy
- Internet Trends 2018
- Internet Trends 2017
- Akamai - The State of the Internet - Security Report Q4 2017
- Akamai - The State of the Internet - Security Report Summer 2018
- Countries with the highest number of internet users as of December 2017 (in millions)
- Number of internet users in the Asia Pacific region as of January 2018, by country (in millions)
- Countries with the biggest share of internet users in Asia as of June 2018, by country
- Digital population in India as of January 2018 (in millions)
- Number of internet users in India from 2015 to 2022 (in millions)
- Number of active mobile social media users in Asia Pacific from September 2017 to January 2018, by country (in millions)
- Number of social network users in India from 2015 to 2022 (in millions)
- Social network user penetration in India from 2015 to 2022
- Penetration of leading social networks in India as of 3rd quarter 2017
- Number of mobile phone messaging app users in India from 2015 to 2020 (in millions)
- Selected emerging mobile markets with the highest WhatsApp penetration rate as of 3rd quarter 2017
- Number of Facebook users in India from 2015 to 2022 (in millions)
- Number of mobile phone internet users in India from 2015 to 2022 (in millions)
- Mobile phone internet user penetration in India from 2015 to 2022
- Mobile phone internet user growth in India from 2016 to 2022
- Most popular smartphone activities in India as of January 2018
- Average number of monthly mobile minutes per visitor worldwide as of May 2017
- Average number of monthly mobile app minutes per visitor worldwide as of May 2017
- Share of mobile-only digital population in selected countries as of May 2017
- Mobile minutes as a percentage of total online retail minutes in selected countries as of May 2017
- Online retail sales in India from 2009 to 2016 (in billion U.S. dollars)
- Annual retail e-commerce sales growth in India from 2017 to 2022
- Most popular online categories in Japan as of May 2015, by reach
- Most popular online categories worldwide as of May 2015, by reach of internet audience
- Most popular online content categories in the United States as of December 2016, by audience reach
- Do you agree or disagree with the statement: "It's often more convenient to use the internet"?
- Do you agree or disagree with the statement: "All the information I need is available online"?
- Internet user penetration in Indonesia from 2015 to 2022
- Total number of internet users in India from June 2012 to June 2016 (in millions)
- Percentage of population using the internet in India from 2000 to 2016
- Fixed and mobile broadband internet subscription penetration in India from 2011 to 2016
- Distribution of internet users in India in 2016 and 2020, by age group
- Distribution of internet users in India in 2016 and 2020, by gender
- Number of internet users in India from October 2014 to December 2017, by region (in millions)
- Internet access in urban India in 2016, by frequency
- Internet access in rural India in 2016, by frequency
- Accessing the internet in urban India in 2016, by reason
- Accessing the internet in rural India in 2016, by reason
- Average time spent online per week by rural users across India in 2016, by activity (in minutes)
- Number of non-English digital entertainment users across India in 2016, by language (in millions)*
- Number of non-English internet users across India in 2016, by activity (in millions)*
- Challenges faced by non-English internet users across India in 2016*
- Limitations in accessing digital governmental services among non-English internet users across India in 2016*
- Adoption rate of online government services among non-English internet users across India in 2016 and 2021, by language*
- Average numbers of hours per day spent by social media users on all social media channels as of 4th quarter 2015, by country
- Active mobile social media penetration in selected Asia-Pacific countries as of January 2018
- Most popular brands on Facebook from India as of October 2018, by number of fans (in millions)
- Total number of mobile wireless subscribers in India from 2010 to 2017 (in millions)
- Total number of mobile internet users in India from June 2012 to June 2016 (in millions)
- Total number of mobile internet users in India from June 2012 to June 2016, by urbanity (in millions)
- Leading online stores in India in 2017, ranked by net e-commerce sales (in million U.S. dollars)
- India: retail e-commerce revenue forecast from 2017 to 2023 (in billion U.S. dollars)
- Digital travel sales in India from 2016 to 2021 (in billion U.S. dollars)
- Average retail e-commerce revenue per user in India from 2017 to 2023 (in U.S. dollars)
- Number of online consumers across India in 2016 and 2017 (in millions)
- Share of online sales in India in 2016, by category
- Share of American internet users who visited Monster in the last month in 2018, by age
Statista offers dossiers and reports on over 170 industries. With Statista you are always able to make informed decisions and boost your work efficiency.
Internet & Telecommunications
- Social Media
- E-Commerce
- Online Video & Entertainment
- Advertising & Marketing
Consumer Goods & FMCG
- Alcoholic Beverages
- Cleaning Products
- Cosmetics & Personal Care
- Food & Nutrition
Retail & Trade
- Health & Hygiene
- International Trade
- Shopping Behavior
- Sports & Leisure
Travel, Tourism & Hospitality
- Business Travel
- Leisure Travel
- Accomodation
- Restaurants
Society
- Demographics
- Economy
- Education & Science
- Politics & Government
Transportation & Logistics
- Aviation
- Rail Transport
- Vehicles & Road Traffic
- Water Transport
Register in seconds and access exclusive features.
Basic Account |
Instant Access
Premium Account | ||
---|---|---|---|
Our servicesClick the question mark for further information | Free |
$49 per month* | |
Basic statistics | |||
Premium statistics | |||
Graph download
| |||
Download PDF | |||
Excel download
| |||
Register | Purchase now |
This feature is limited to our corporate solutions.
Please contact us to get started with full access to dossiers, forecasts, studies and international data.

Updates on eCommerce, Digital Media, eTravel, eServices and more
- Market figures for 2018 to 2023
- Company and startup profiles
- User demographics

U.S. coal production has steadily declined in the past decade, but has been in the news in recent years due to President Trump's desire to revitalize the industry. This document provides an overview of the key figures, leading companies, and the employment trends in the U.S. coal mining industry.

This new export feature offers
- Structured graphical representation of the data
- Tailored target group analysis
- Option for further processing

The Polish e-commerce market is one of the fastest developing e-commerce markets in Europe. The latest data for Poland is presented in this dossier.

Plastic waste is an issue of global concern. Since China banned the import of recycled plastic, the U.S. has had to make adjustments to its management of plastic waste. This dossier provides an overview of plastic waste in the U.S.

This dossier provides an overview of hedge funds worldwide. Global hedge fund assets, performance, investors, and other topics are highlighted.

The Outdoor Advertising Association of America covers amongst others
- Number of billboards
- Outdoor advertising revenue
- Number of out-of-home displays

Find data, perceptions & more about
- Economic consequences
- Impact on the labor market
- A second referendum

Understand the recent developments in the Spanish eCommerce market!
- URL-related revenues
- Relevant online store KPIs
- eCommerce-related contacts

- Extended statistical dossier
- Insights, explanations & interpretations
- Challenges of the digital future

eCommerce is rapidly becoming a part of the Latin American shopping culture. The dossier includes data on
- Regional online shopping events
- Events by country

The outline of potential impacts of Brexit on UK industries has been updated in the UK Industry Reports.

Italian enterprises invest significantly in digital marketing. Find out about
- Relevant aspects & KPIs
- New trends
- Different strategies

Statista European Football Benchmark
- The big 5 European leagues
- All about the clubs & fans
- Sponsors & how they fit in

What are online shoppers' payment preferences around the world?
- Data on all payment methods
- Analysis for 50 countries
- Forecasts up to 2023

The kingdom of Saudi Arabia has faced political challenges.
- Perceptions & trade information
- Conflicts with Yemen, Iran, Qatar & Turkey
We use cookies to personalize contents and ads, offer social media features, and analyze access to our website. In your browser settings you can configure or disable this, respectively, and can delete any already placed cookies. For details, please see your browser’s Help section (by pressing F1). Please see our privacy statement for details about how we use data.