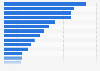
This statistic ranks the average monthly per-app revenue according to global app developers as of November 2015, sorted by operating system. According to the industry survey, iOS app developers earned an average of 8,100 U.S. dollars every month. The biggest earners were Windows Phone app developers with average per-app revenues of 11,400 U.S. dollars.
Average monthly revenue per app according to global app developers as of November 2015, by OS
(in 1,000 U.S. dollars)
Original question: How much revenue per month do you generate from mobile apps on your primary platform and all other platforms combined (on average, in U.S. dollars)? Revenue numbers exclude China, Japan and Korea markets. Values may not add up to 100 percent due to rounding.
Profit from the additional features of your individual account
Currently, you are using a shared account. To use individual functions (e.g., mark statistics as favourites, set
statistic alerts) please log in with your personal account.
If you are an admin, please authenticate by logging in again.
Learn more about how Statista can support your business.
InMobi. (February 8, 2016). Average monthly revenue per app according to global app developers as of November 2015, by OS (in 1,000 U.S. dollars) [Graph]. In Statista. Retrieved November 09, 2024, from https://www.statista.com/statistics/515157/developer-mobile-app-average-revenue-by-os/
InMobi. "Average monthly revenue per app according to global app developers as of November 2015, by OS (in 1,000 U.S. dollars)." Chart. February 8, 2016. Statista. Accessed November 09, 2024. https://www.statista.com/statistics/515157/developer-mobile-app-average-revenue-by-os/
InMobi. (2016). Average monthly revenue per app according to global app developers as of November 2015, by OS (in 1,000 U.S. dollars). Statista. Statista Inc.. Accessed: November 09, 2024. https://www.statista.com/statistics/515157/developer-mobile-app-average-revenue-by-os/
InMobi. "Average Monthly Revenue per App According to Global App Developers as of November 2015, by Os (in 1,000 U.S. Dollars)." Statista, Statista Inc., 8 Feb 2016, https://www.statista.com/statistics/515157/developer-mobile-app-average-revenue-by-os/
InMobi, Average monthly revenue per app according to global app developers as of November 2015, by OS (in 1,000 U.S. dollars) Statista, https://www.statista.com/statistics/515157/developer-mobile-app-average-revenue-by-os/ (last visited November 09, 2024)
Average monthly revenue per app according to global app developers as of November 2015, by OS (in 1,000 U.S. dollars) [Graph], InMobi, February 8, 2016. [Online]. Available: https://www.statista.com/statistics/515157/developer-mobile-app-average-revenue-by-os/