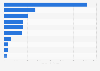
This statistic presents the per capita spending on apparel in selected countries in Europe in 2015. In 2015, the biggest spenders on apparel were consumers in the United Kingdom (UK), who spent 928 British pounds per capita on apparel. Following in second place was Italian consumers, who spend 913 British pounds per capita on apparel. Across the selected countries, Spanish shoppers spend the least on apparel, at approximately 517 pounds per capita.
Per capita spending on apparel in selected countries in Europe in 2015 (in GBP)
Basic Account
Get to know the platform
You only have access to basic statistics.
This statistic is not included in your account.
Starter Account
The ideal entry-level account for individual users
- Instant access to 1m statistics
- Download in XLS, PDF & PNG format
- Detailed references
$189 USD $149 USD / Month *
in the first 12 months
Professional Account
Full access
Business Solutions including all features.
* Prices do not include sales tax.
Other statistics that may interest you Statistics on
About the industry
10
- Basic Statistic Clothing and footwear purchase trend in the United Kingdom (UK) Q1 2012 - Q4 2022
- Premium Statistic Expenditure on clothing materials in the United Kingdom (UK) 2005-2022
- Basic Statistic Consumer spending on clothing in the Czechia 2011-2022
- Premium Statistic U.S. consumer apparel spend per transaction by generation 2018
- Premium Statistic European countries with highest per capita spend on apparel 2016
- Premium Statistic Global consumers buying apparel every month in 2017, by country/region
- Premium Statistic Colombia: top apparel companies in the reputation index 2023
- Premium Statistic Colombia: employment in apparel manufacturing 2014-2021
- Premium Statistic Clothing & footwear: retail sales value percentage change in Great Britain 2011-2022
- Basic Statistic Polo Ralph Lauren's revenue share as of 2023, by region
About the region
10
- Basic Statistic Consumer spending on footwear in France 2010-2021
- Premium Statistic Share of online shopping in French women's fashion purchases 2008-2016
- Basic Statistic Fashion: top 5 online stores in France in 2022, by net sales
- Premium Statistic Fashion e-commerce user in France 2019-2027, by segment
- Premium Statistic E-commerce revenue in France 2019-2027, by segment
- Premium Statistic Value of clothing exports from France 2000-2021
- Basic Statistic Number of employees in the wearing apparel manufacturing sector in France 2009-2020
- Basic Statistic France: number of wearing apparel manufacturers 2009-2020
- Basic Statistic Turnover of the manufacture of wearing apparel in France 2009-2020
- Basic Statistic Personnel costs of the manufacture of wearing apparel in France 2011-2020
Selected statistics
10
- Basic Statistic Adidas Group's global net sales from 2002 to 2022, by product category
- Basic Statistic Puma Group's market capitalization worldwide 1993-2022
- Premium Statistic Footwear retail sales volume trend in Great Britain (UK) 2008-2022
- Basic Statistic Revenues of VF Corporation's active segment worldwide 2016 to 2023
- Basic Statistic Victoria's Secret's net sales worldwide from 2010 to 2022
- Premium Statistic Number of Hugo Boss stores worldwide in 2022, by region
- Basic Statistic Net earnings of the Puma Group worldwide from 1993 to 2022
- Basic Statistic Number of Hugo Boss stores worldwide in 2020, by store type
- Basic Statistic Hugo Boss - EBITDA 2005-2022
- Basic Statistic Total value of U.S. clothing imports 2011-2021
Other regions
9
- Premium Statistic Percentage change in sales volume of children's wear in Italy 2017-2020
- Premium Statistic Footwear store monthly sales U.S. from 2017 to 2023
- Basic Statistic Growth rate of retail sector in Germany 2013-2016, by product
- Premium Statistic Expenditure on footwear in the United Kingdom (UK) 2005-2022
- Premium Statistic Production volume of textile fibers in Vietnam 2010-2022
- Basic Statistic The Children's Place's number of stores in North America as of 2022
- Premium Statistic E-commerce spending per capita in Europe 2021, by country
- Premium Statistic Industry revenue of “Rubber coated fabric and its products“ in Japan 2012-2024
- Premium Statistic Discretionary expense on apparel among consumers India 2020, by city tier
Related statistics
10
- Premium Statistic Import value of women's intimate fashion articles in Spain 2022, by country
- Premium Statistic Men's synthetic fiber underwear export quantity Spain 2022, by country
- Premium Statistic Value of imports of men's synthetic pajamas Spain 2022, by country
- Premium Statistic Colombia: household spending on fashion articles 2017-2022
- Premium Statistic Colombia: export value of knit sweaters 2021, by country
- Premium Statistic Argentina: export value of knit sweaters 2021, by country
- Premium Statistic El Salvador: export value of knit sweaters 2021, by country
- Premium Statistic Peru: export value of knit sweaters 2021, by country
- Premium Statistic Revenue distribution in men's textile industry Spain 1999-2021
- Premium Statistic Revenue distribution in home textile industry Spain 1999-2021
Further related statistics
10
- Under Armour's operating income worldwide 2008-2023
- Retail video market: consumer spending on physical video in France 2008-2021
- Net sales of Dick's Sporting Goods U.S. 2006-2022
- Employee compensation and benefits at Deutsche Bank 2006-2022
- Organic food market: leading countries 2021, based on sales
- Equity of the International Federation of Association Football (FIFA) 2003-2022
- U.S. oil and gas industry capex 2010-2021
- Number of Nike stores globally 2009-2023
- Champions League total revenue 2010-2022
- UEFA EURO revenue from commercial rights 1992-2020
Further Content: You might find this interesting as well
Statistics
- Under Armour's operating income worldwide 2008-2023
- Retail video market: consumer spending on physical video in France 2008-2021
- Net sales of Dick's Sporting Goods U.S. 2006-2022
- Employee compensation and benefits at Deutsche Bank 2006-2022
- Organic food market: leading countries 2021, based on sales
- Equity of the International Federation of Association Football (FIFA) 2003-2022
- U.S. oil and gas industry capex 2010-2021
- Number of Nike stores globally 2009-2023
- Champions League total revenue 2010-2022
- UEFA EURO revenue from commercial rights 1992-2020
Fung Global Retail & Technology. (November 30, 2016). Per capita spending on apparel in selected countries in Europe in 2015 (in GBP) [Graph]. In Statista. Retrieved September 24, 2023, from https://www.statista.com/statistics/737205/spending-apparel-per-capita-europe/
Fung Global Retail & Technology. "Per capita spending on apparel in selected countries in Europe in 2015 (in GBP)." Chart. November 30, 2016. Statista. Accessed September 24, 2023. https://www.statista.com/statistics/737205/spending-apparel-per-capita-europe/
Fung Global Retail & Technology. (2016). Per capita spending on apparel in selected countries in Europe in 2015 (in GBP). Statista. Statista Inc.. Accessed: September 24, 2023. https://www.statista.com/statistics/737205/spending-apparel-per-capita-europe/
Fung Global Retail & Technology. "Per Capita Spending on Apparel in Selected Countries in Europe in 2015 (in Gbp)." Statista, Statista Inc., 30 Nov 2016, https://www.statista.com/statistics/737205/spending-apparel-per-capita-europe/
Fung Global Retail & Technology, Per capita spending on apparel in selected countries in Europe in 2015 (in GBP) Statista, https://www.statista.com/statistics/737205/spending-apparel-per-capita-europe/ (last visited September 24, 2023)
Per capita spending on apparel in selected countries in Europe in 2015 (in GBP) [Graph], Fung Global Retail & Technology, November 30, 2016. [Online]. Available: https://www.statista.com/statistics/737205/spending-apparel-per-capita-europe/