Consumer Insights
Charts
Charts is where you go straight to the survey data itself: the exact question and how people answered it. Consumer AI returns answers built from the survey data. Charts lets you access the underlying data directly, useful when you need a specific figure or want to see the full scope of a survey.
Charts opens on the survey modules: Global Survey, Brand KPI, Media & Touchpoints, and Pulse Survey. These are the surveys Consumer Insights is built on, and this is where you access them directly.
Two ways to find a chart:
1. Search
Type a keyword or query at the top. Fastest when you know what you're after.
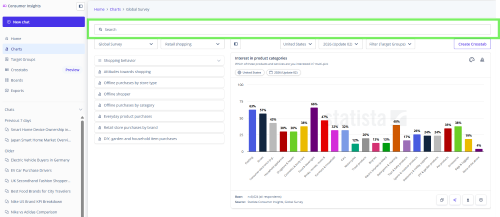
2. Browse
Pick a survey, then a category, then a question. Best when you're not sure what's available or don't have a specific question in mind yet.
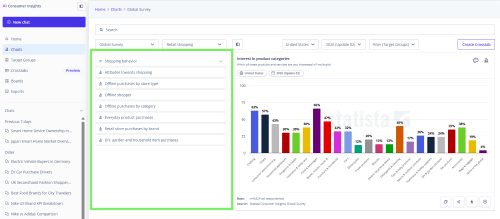
Reading a chart
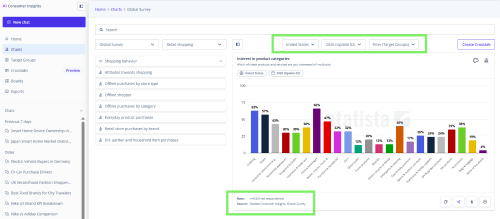
- Country, wave, and target group sit at the top, which shows the country, the year, and the audience in the chart.
- Source and base sit at the bottom. The source is which survey the data came from. The base (n=) is how many people answered. It tells you how broadly the result applies, with a larger base meaning the finding reflects a wider population.
Watch the base size. We flag bases under 100 to help track robustness. Larger bases offer higher statistical confidence, but smaller samples remain fully actionable for specific audiences.
Working with a chart
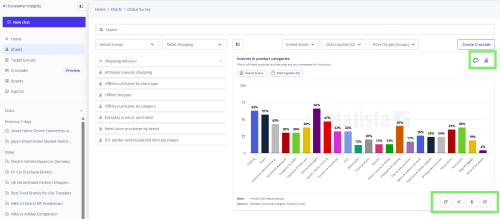
The controls on every chart:
- Chart type: switch between column, bar, line, and table.
- Colors: change the chart's colors.
- Share / Copy / Copy for AI: share it, copy it, or copy the chart's data along with its source, question, and base, formatted to paste into another AI tool.
- Download: PNG, SVG, PDF, CSV, or Excel.
- Add to board: save it to a board with your current settings.