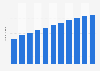
The timeline shows the number of mobile-only monthly active Facebook users. As of the fourth quarter of 2016, 1,149 million Facebook users accessed the social media site exclusively via mobile device every month, up from 823 million users in the corresponding quarter of the previous year.
Number of mobile-only monthly active Facebook users as of 4th quarter 2016
(in millions)
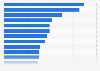
Profit from the additional features of your individual account
Currently, you are using a shared account. To use individual functions (e.g., mark statistics as favourites, set
statistic alerts) please log in with your personal account.
If you are an admin, please authenticate by logging in again.
Learn more about how Statista can support your business.
Facebook. (February 1, 2017). Number of mobile-only monthly active Facebook users as of 4th quarter 2016 (in millions) [Graph]. In Statista. Retrieved July 27, 2024, from https://www.statista.com/statistics/281600/number-of-mobile-only-facebook-users/
Facebook. "Number of mobile-only monthly active Facebook users as of 4th quarter 2016 (in millions)." Chart. February 1, 2017. Statista. Accessed July 27, 2024. https://www.statista.com/statistics/281600/number-of-mobile-only-facebook-users/
Facebook. (2017). Number of mobile-only monthly active Facebook users as of 4th quarter 2016 (in millions). Statista. Statista Inc.. Accessed: July 27, 2024. https://www.statista.com/statistics/281600/number-of-mobile-only-facebook-users/
Facebook. "Number of Mobile-only Monthly Active Facebook Users as of 4th Quarter 2016 (in Millions)." Statista, Statista Inc., 1 Feb 2017, https://www.statista.com/statistics/281600/number-of-mobile-only-facebook-users/
Facebook, Number of mobile-only monthly active Facebook users as of 4th quarter 2016 (in millions) Statista, https://www.statista.com/statistics/281600/number-of-mobile-only-facebook-users/ (last visited July 27, 2024)
Number of mobile-only monthly active Facebook users as of 4th quarter 2016 (in millions) [Graph], Facebook, February 1, 2017. [Online]. Available: https://www.statista.com/statistics/281600/number-of-mobile-only-facebook-users/