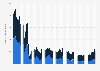
- Retail & Trade›
- Shopping Behavior›
Share of U.S. consumers who took advantage of coupons for free products 2016
Industry-specific and extensively researched technical data (partially from exclusive partnerships).
A paid subscription is required for full access.
Share of U.S. consumers who took advantage of coupons for free products 2016
How often do you take advantage of coupons for free products (e.g. 2-for-1 deals, giveaways)?

How often do you take advantage of coupons for free products (e.g. 2-for-1 deals, giveaways)?
Share of respondents | |
---|---|
- | - |
- | - |
- | - |
- | - |
- | - |
Share of respondents | |
---|---|
- | - |
- | - |
- | - |
- | - |
- | - |
You need a Premium Account for unlimited access.
Full access to 1m statistics
Incl. source references
Available to download in PNG, PDF, XLS format
You need a Premium Account for unlimited access.
Full access to 1m statistics
Incl. source references
Available to download in PNG, PDF, XLS format
© Statista 2019
About this statistic
Show source
Please be patient - this may take a moment
Description
Source
More information
- Show sources information
- Show publisher information
- Release date
- January 2017
- Region
- United States
- Survey time period
- August 8 to 20, 2016
- Number of respondents
- total survey n=1,000
- Age group
- 18 years and older
- Method of interview
- Online survey
- Supplementary notes
- Original question: "How often do you take advantage of the following kinds of discounts or deals?" Original item: "coupons for free products (e.g. 2-for-1 deals, giveaways,)"
Source
- Show sources information
- Show publisher information
- Release date
- January 2017
More information
- Region
- United States
- Survey time period
- August 8 to 20, 2016
- Number of respondents
- total survey n=1,000
- Age group
- 18 years and older
- Method of interview
- Online survey
- Supplementary notes
- Original question: "How often do you take advantage of the following kinds of discounts or deals?" Original item: "coupons for free products (e.g. 2-for-1 deals, giveaways,)"
You only have access to basic statistics.
This statistic is not included in your account!
- Instant access to 1m statistics
- Download in XLS, PDF & PNG format
- Detailed references
$59 / Month *
Corporate solution including all features.
Prices do not include sales tax.


I think of Statista as Google for researchers. Statista provides you with the information you search for right away.Dr. Horst Stipp
EVP, Research & Innovation, Advertising Research Foundation
- Overview
- Most popular coupon websites in the United States as of March 2019, based on average monthly visits (in millions)Most visited coupon websites in the U.S. 2019
- Most popular types of coupon websites according to adults in the United States as of 3rd quarter 2018U.S. coupon acquisition websites 2018
- Most popular types of mobile saving and couponing apps according to adults in the United States as of 3rd quarter 2018U.S. coupon and saving app reach 2018
- Ways in which internet users in the United States save money during their shopping journey as of March 2018, by age groupU.S. online user money saving strategies while shopping 2018, by age
- Consumers who ever use coupons for shopping in the United States from 2017 to 2019Coupon use in the United States 2017-2019
- How often consumers use coupons when shopping in the United States from 2017 to 2019Coupon usage frequency U.S. consumers 2017-2019
- Mobile shopping app user acquisition costs worldwide as of March 2019, by type (in U.S. dollars)Global mobile shopping app user acquisition costs 2019, by type
- Shopping influence
- Importance of discounts and coupons to the overall digital purchasing decisions according to internet users in the United States as of March 2018, by age groupImportance of discount & coupons in digital purchases in the U.S. 2018, by age group
- How do you usually find out about new interesting products?Sources of inspiration for new products in the U.S. 2019
- How do you search for specific information on a product that you want to buy?Sources of information about products in the U.S. 2019
- How do you usually pay when you shop online?Usually used payment option in online shops by U.S. consumers 2018
- Which payment option do you prefer for online purchases?Preferred payment option when shopping online by U.S. consumers 2018
- Leading factors that influenced consumers to shop in-store during a recent trip in the United States in 2019Factors that influence consumers to shop in-store in the U.S. in 2019
- Most common reasons for Gen Z internet users in the United States to buy online and pick up in-store (BOPUS) as of May 2019U.S. Gen Zers buy online and pick up in-store usage reasons 2019
- Leading reasons why smartphone users in the United States unsubscribe from a brand or company's mobile messaging services as of May 2019Reasons why U.S. smartphone users unsubscribe from brand mobile messages 2019
- Mobile usage
- Paperless and mobile coupon usage of adults in the United States as of 3rd quarter 2018, by typeU.S. adults paperless and mobile coupon usage reach 2018, by type
- Preferred way of receiving mobile coupons from retailers according to internet users in the United States as of September 2018Preferred channel to receive mobile coupons from retailers in the U.S. 2018
- Reasons for using a mobile wallet according to smartphone users in the United States as of May 2019U.S. consumer motivation for using a mobile wallet 2019
- Most popular types of in-app notifications among smartphone users in the United States as of May 2019Leading in-app notifications among U.S. smartphone users 2019
- Most popular mobile shopping apps in the United States as of September 2019, by reachMost popular e-commerce apps in the U.S. 2019, by reach
- Most popular mobile shopping apps in the United States as of September 2019, by monthly users (in millions)Most popular e-commerce apps in the U.S. 2019, by audience
- Groupon
- Groupon's revenue in North America from 2009 to 2018 (in million U.S. dollars)Groupon: annual revenue in North America 2009-2018
- Revenue of Groupon from 1st quarter 2009 to 3rd quarter 2019 (in million U.S. dollars)Groupon: quarterly revenue 2009-2019
- Groupon's net income/loss from 1st quarter 2015 to 3rd quarter 2019 (in million U.S. dollars)Groupon: quarterly net income/loss 2015-2019
- Number of Groupon's active customers from 2nd quarter 2009 to 3rd quarter 2019 (in millions)Groupon: number of active customers 2009-2019
- Groupon's trailing twelve months gross profit per average active customer from 3rd quarter 2017 to 3rd quarter 2019 (in U.S. dollars)Groupon: TTM gross profit per average active customer 2017-2019
- Percentage of global Groupon sales completed through mobile devices as of June 2019Groupon: mobile sales share 2013-2019
- Number of mobile Groupon app downloads worldwide as of September 2019 (in millions)Groupon: number of mobile app downloads 2013-2019
- Rewards U.S. consumers redeemed their points for in 2016, by income
- Share of U.S. consumers who took advantage of current deals from weekly ads 2016
- Share of U.S. consumers who use coupons for consumer electronics at restaurants 2016
- Share of U.S. consumers who use coupons for furniture at restaurants or retail stores
- Share of U.S. consumers who took advantage of loyalty offers 2016
- Locations where U.S. consumers redeemed coupons once a month or more often in 2016
- Reasons why U.S. consumers search for promo codes 2016
- U.S. consumers who would submit their bank details to redeem a coupon or gift card
- Share of U.S. consumers who took advantage of rewards programs 2016
- Sites where U.S. consumers usally find coupons to use at restaurants or stores
- Share of U.S. consumers who use coupons for vacation trips at restaurants in 2016
- Reasons that kept U.S. consumers from using a coupon or promo code 2016
- Annual growth in sold coupons on group buying platforms in China 2012-2014
- Consumer response on methods of coupon redemption in the U.S. 2016
- Consumer money saving behaviors in the U.S. 2016
- Places where shoppers regularly discover coupons in the U.S. 2015
- Most visited coupon websites in the U.S. 2019
- U.S. coupon acquisition websites 2018
- U.S. coupon and saving app reach 2018
- U.S. online user money saving strategies while shopping 2018, by age
- Coupon use in the United States 2017-2019
- Coupon usage frequency U.S. consumers 2017-2019
- Global mobile shopping app user acquisition costs 2019, by type
- Importance of discount & coupons in digital purchases in the U.S. 2018, by age group
- Sources of inspiration for new products in the U.S. 2019
- Sources of information about products in the U.S. 2019
- Usually used payment option in online shops by U.S. consumers 2018
- Preferred payment option when shopping online by U.S. consumers 2018
- Factors that influence consumers to shop in-store in the U.S. in 2019
- U.S. Gen Zers buy online and pick up in-store usage reasons 2019
- Reasons why U.S. smartphone users unsubscribe from brand mobile messages 2019
- U.S. adults paperless and mobile coupon usage reach 2018, by type
- Preferred channel to receive mobile coupons from retailers in the U.S. 2018
- U.S. consumer motivation for using a mobile wallet 2019
- Leading in-app notifications among U.S. smartphone users 2019
- Most popular e-commerce apps in the U.S. 2019, by reach
- Most popular e-commerce apps in the U.S. 2019, by audience
- Groupon: annual revenue in North America 2009-2018
- Groupon: quarterly revenue 2009-2019
- Groupon: quarterly net income/loss 2015-2019
- Groupon: number of active customers 2009-2019
- Groupon: TTM gross profit per average active customer 2017-2019
- Groupon: mobile sales share 2013-2019
- Groupon: number of mobile app downloads 2013-2019
- Rewards U.S. consumers redeemed their points for in 2016, by income
- Share of U.S. consumers who took advantage of current deals from weekly ads 2016
- Share of U.S. consumers who use coupons for consumer electronics at restaurants 2016
- Share of U.S. consumers who use coupons for furniture at restaurants or retail stores
- Share of U.S. consumers who took advantage of loyalty offers 2016
- Locations where U.S. consumers redeemed coupons once a month or more often in 2016
- Reasons why U.S. consumers search for promo codes 2016
- U.S. consumers who would submit their bank details to redeem a coupon or gift card
- Share of U.S. consumers who took advantage of rewards programs 2016
- Sites where U.S. consumers usally find coupons to use at restaurants or stores
- Share of U.S. consumers who use coupons for vacation trips at restaurants in 2016
- Reasons that kept U.S. consumers from using a coupon or promo code 2016
- Annual growth in sold coupons on group buying platforms in China 2012-2014
- Consumer response on methods of coupon redemption in the U.S. 2016
- Consumer money saving behaviors in the U.S. 2016
- Places where shoppers regularly discover coupons in the U.S. 2015
Statista offers dossiers and reports on over 170 industries. With Statista you are always able to make informed decisions and boost your work efficiency.
- Social Media
- E-Commerce
- Online Video & Entertainment
- Advertising & Marketing
- Alcoholic Beverages
- Cleaning Products
- Cosmetics & Personal Care
- Food & Nutrition
- Health & Hygiene
- International Trade
- Shopping Behavior
- Sports & Leisure
- Business Travel
- Leisure Travel
- Accomodation
- Restaurants
- Demographics
- Economy
- Education & Science
- Politics & Government
- Aviation
- Rail Transport
- Vehicles & Road Traffic
- Water Transport
You can only download this statistic as a Premium user.
As a Premium user you get access to the detailed source references and background information about this statistic.
As a Premium user you get access to background information and details about the release of this statistic.
As soon as this statistic is updated, you will immediately be notified via e-mail.
...and make my research life easier.
You need at least a Premium Account to use this feature.
This feature is limited to our corporate solutions.
Please contact us to get started with full access to dossiers, forecasts, studies and international data.
We use cookies to personalize contents and ads, offer social media features, and analyze access to our website. In your browser settings you can configure or disable this, respectively, and can delete any already placed cookies. For details, please see your browser’s Help section (by pressing F1). Please see our privacy statement for details about how we use data.