The United States issued a total of 612,258 immigrant visas last year, according to data from the U.S. Department of State’s Bureau of Consular Affairs. This marks a 9 percent increase from 2023, when 562,976 immigrant visas were issued.
There are two types of U.S. visa: immigrant and non-immigrant. This chart focuses on former visas, which are for foreign nationals intending to live permanently in the United States and can be employment or family-based, as well as falling under the categories of adoption, special immigrant categories (including former U.S. government employees) and the diversity visa. The non-immigrant visa, not shown here, is for people coming to the U.S. temporarily for specific purposes, such as tourism, business, temporary work, or study, and includes the H-1B and F-1 visas.
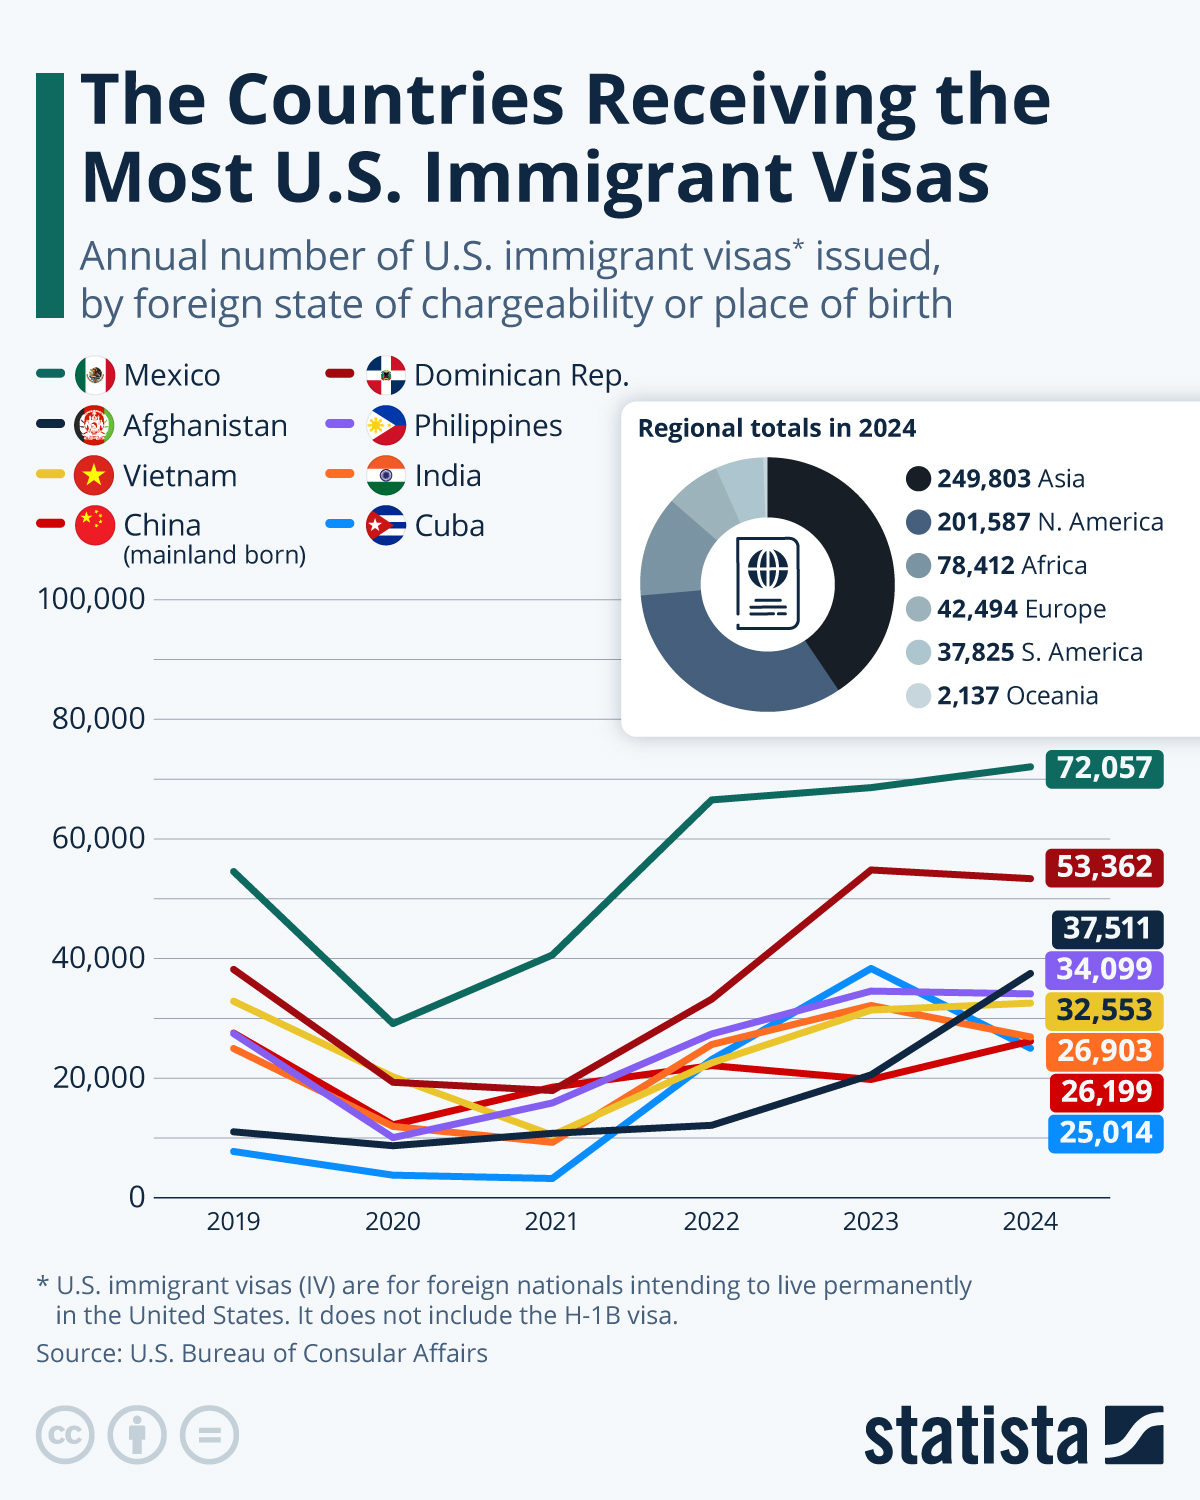
In 2024, the largest number of immigrant visas were issued to Mexican nationals at 72,057, accounting for around 12 percent of total immigrant visas that year. It was followed by the Dominican Republic, with 53,362 visas, or 9 percent of the total, and Afghanistan with 37,511 visas issued, or 6 percent. India and China, the world’s two most populous nations, also appear in the top roundup, with 26,903 and 26,199 visas issued, respectively. Together, the top eight countries listed here accounted for half (50.3 percent) of total immigrant visas issued in 2024.
There was a drop in the number of visas issued during the Covid-19 pandemic, when posts were instructed to suspend routine visa services and provide only mission critical and emergency services in late March 2020, resuming limited services in July. This chart looks back only to 2019, as the visa office changed its methodology for calculating visa data that fiscal year.