Skip to main content
Consumer Goods & FMCG
E-Commerce
Economy & Politics
Energy & Environment
Health, Pharma & Medtech
Internet
Media
Technology & Telecommunications
Transportation & Logistics
Travel, Tourism & Hospitality
View all industries
Global data volume growth
Global AI market size
Number of generative AI users worldwide
Global inflation rate
Retail e-commerce sales worldwide
Largest economies worldwide
Biggest social media platforms by users
Global EV market share by manufacturer
International tourist arrivals by world region
Global annual CO₂ emissions
Browse recent statistics
Artificial intelligence (AI) worldwide
TikTok
Nvidia
E-commerce worldwide
Global GDP
Instagram
Apparel market worldwide
Video gaming worldwide
Global renewable energy industry
Influencer marketing worldwide
Browse recent topics
Consumer Trends 2026
Artificial Intelligence: in-depth market analysis
E-commerce challenges
Global economy
TikTok
Luxury goods: in-depth market analysis
Electric vehicles: A global overview
Video gaming worldwide
Travel and tourism trends 2026
Battery recycling worldwide
Browse recent reports
Explore the tool
Explore Classic mode
Advertising & Media
eCommerce
Consumer
Finance
Global Indicators
Health
Industrial
Mobility
Technology
Explore Market Insights
eCommerce Insights
Research AI
Book a demo
All integrations
Developer docs
Explore Statista Connect
Research
Strategy & Consulting
Marketing
Media & PR
Explore AI assistants
Marketing
Research & Development
Strategy
Sales
Find the fact
Tell the story
Win the pitch
Understand the market
Develop your strategy
Academia
Agencies
Consultancies
Consumer goods
Finance
Tech
Research solutions
Strategy consulting
Communication services
Explore Statista+
Statista R
Statista Healthcare
About Statista
First steps & help center
Webinar & training hub
Success stories
Individuals & Small Teams
Businesses & Enterprises
Academia & Government
English
Deutsch
Daily Data
Global stories vividly visualized
Aug 22, 2014
This chart gives an overview of the ALS Ice Bucket Challenge by the numbers
More Information
Aug 21, 2014
Mean number of URLs requested to be removed from Google search per day.
More Information
Aug 21, 2014
This chart shows transfer window spending 2013 vs 2014 (in million U.S. dollars).
More Information
Aug 20, 2014
This chart shows how often U.S. Internet users unplug.
More Information
Aug 20, 2014
This chart shows the value of military donations to law enforcement agencies (in million U.S. dollars),
More Information
Aug 20, 2014
This chart shows views on airstrikes against IS militants in Iraq.
More Information
Aug 19, 2014
This chart shows the launch weekend iPhone sales since 2008.
More Information
Aug 19, 2014
This chart shows the most stolen cars in the United States in 2013 in total units.
More Information
Aug 18, 2014
This chart shows the worldwide box office gross of movies starring Robin Williams (in million U.S. dollars).
More Information
Aug 15, 2014
This chart shows how the prices of smartphones shipped in Q2 2014 differ depending on their operating system.
More Information
Aug 15, 2014
This chart shows an age breakdown for nuclear reactors that are currently operational and for those that have already been shut down.
More Information
Aug 15, 2014
This chart shows the share of live births occurring outside marriage in the U.S. and selected European countries.
More Information
Aug 14, 2014
This chart shows the wind share of electricity generation in leading countries in 2013.
More Information
Aug 14, 2014
This chart shows the percentage of female employees in the workforce of selected American tech companies.
More Information
Aug 13, 2014
This chart shows the growth of Tencent's instant messaging and social media platforms.
More Information
Aug 13, 2014
This chart shows the value of sanctioned food exports to Russia by country
More Information
Aug 12, 2014
This chart shows the most popular social media apps among U.S. millennials in June 2014.
More Information
Aug 12, 2014
This chart shows how many people have been infected with and killed by Ebola during the virus' most recent outbreak in West Africa.
More Information
Aug 12, 2014
This chart shows the percentage of jobs vulnerable to computerization/automation in the EU
More Information
Aug 11, 2014
This chart shows the percentage of Americans who have no retirement savings/pensions by age group.
More Information
Aug 8, 2014
This chart shows Zynga's revenue from the first quarter of 2009 through the second quarter of 2014.
More Information
Aug 8, 2014
This chart compares the subscription revenue of pay-TV provider HBO to Netflix's streaming subscription revenue.
More Information
Aug 8, 2014
This chart shows the percent of all spam in Q2 2014 originating in each country.
More Information
Aug 8, 2014
This chart shows the top spending countries during visits to the UK for at least one night in 2013.
More Information
Aug 7, 2014
This chart shows how Americans' use of screen media has changed between the first quarter of 2013 and the first quarter of 2014.
More Information
Aug 7, 2014
This chart shows the percentage of people in selected countries stating that they are "constantly looking at screens these days".
More Information
Aug 7, 2014
This chart shows the percentage of the U.S. population using marijuana in the past month.
More Information
Aug 7, 2014
This chart shows primary shopping/purchasing channels among adults in Great Britain.
More Information
Aug 6, 2014
This chart shows green on blue attacks in Afghanistan and ISAF fatalities.
More Information
Aug 5, 2014
This chart shows which mobile wallet services American consumers have used in the past.
More Information
Aug 5, 2014
This chart shows the top 5 earning actors/actresses in 2014.
More Information
Aug 4, 2014
This chart shows the highest ancestral concentration in U.S./metro areas in 2014
More Information
Aug 4, 2014
This chart shows the global share of iOS and Android mobile/tablet traffic.
More Information
Aug 1, 2014
This chart shows LinkedIn's revenue growth since Q1 2009.
More Information
Aug 1, 2014
This chart shows the percentage of people from selected countries thinking that climate change is largely the result of human activity.
More Information
Aug 1, 2014
This chart shows plastic surgery procedures per 1,000 people in 2013
More Information
Jul 31, 2014
This chart shows the 10 largest lobbying spenders in the United States, based on their lobbying spending in 2014.
More Information
Jul 30, 2014
This chart shows large recalls among car manufacturers (in million vehicles)*.
More Information
Jul 30, 2014
This chart shows answers to the question "who is most responsible for the current violence in Gaza/Israel?"
More Information
Jul 29, 2014
This chart shows the highest-earning country musicians worldwide in 2014.
More Information
Jul 28, 2014
This chart shows tablet market share of the five largest tablet vendors in the second quarter of 2014.
More Information
Jul 28, 2014
This chart sums up the results of the Human Development Report 2014, issued by the United Nations Development Programme.
More Information
Jul 28, 2014
This chart shows U.S. government expenditure fighting forest fires.
More Information
Jul 25, 2014
This chart shows the top 15 cities worldwide with the highest percentage of millionaires in 2014.
More Information
Jul 24, 2014
This chart shows a gender breakdown of selected tech companies' global workforce.
More Information
Jul 24, 2014
This charts shows Facebook's monthly active users, broken down by the type of device they access the social network on.
More Information
Jul 24, 2014
This chart shows the percentage of the population below the poverty level in U.S. cities in 2014.
More Information
Jul 23, 2014
This chart shows mobile app usage by Android and iPhone users in the United States by age.
More Information
Jul 23, 2014
Based on the example of Showtime TV series Dexter and Homeland, this chart nicely illustrates how TV watching habits have evolved over...
More Information
Jul 23, 2014
This chart shows the percentage of gas supplied by Russia to European countries.
More Information
Jul 22, 2014
This infographic illustrates key facts on U.S. fast food giant McDonald's.
More Information
Jul 22, 2014
This chart shows the percentage of overall traffic to websites coming from Facebook or Twitter referrals. Next to social referrals,...
More Information
Jul 21, 2014
This chart shows the ten largest crypto-currencies, based on their market capitalization in July 2014.
More Information
Jul 18, 2014
This chart shows the top 10 wealthiest families in the United States in 2014.
More Information
Jul 16, 2014
This chart shows many people from selected countries think it's acceptable for the U.S. government to monitor communications from regular...
More Information
Jul 16, 2014
This infographic shows where, how and when Americans like to spend their summer holidays.
More Information
Jul 16, 2014
This chart provides an overview of military attacks since July 8th 2014.
More Information
Jul 15, 2014
This chart shows the brand retention rate for selected smartphone vendors.
More Information
Jul 14, 2014
This chart shows key facts on Twitter's video sharing service Vine, on its users and why marketers shouldn't ignore it.
More Information
Jul 14, 2014
This chart shows the most tweeted-about matches of the 2014 FIFA World Cup in Brazil.
More Information
Jul 11, 2014
This chart shows the quarterly growth of global PC shipments.
More Information
Jul 9, 2014
This chart shows the biggest World Cup wins in history.
More Information
Jul 8, 2014
This chart breaks down smartphone sales in four major markets between March and May 2014, by operating system.
More Information
Jul 8, 2014
This chart shows annual alcohol-attributable deaths per 100,000 residents by state.
More Information
Jul 3, 2014
This chart shows the average number of goals scored per match during different stages of the 2014 FIFA World Cup in Brazil.
More Information
Jul 3, 2014
This chart shows active devices running Android by version and smartwatch compatibility.
More Information
Jul 3, 2014
This chart shows the smartphone sales share in the UK by operating system.
More Information
Jul 2, 2014
This chart shows how many apps U.S. smartphone owners use per month and how much time they spend with apps.
More Information
Jul 2, 2014
This chart shows the UK App Economy revenue forecast 2013-2025
More Information
Jul 1, 2014
This chart shows the number of days lost through sickness absence from 1993 to 2013.
More Information
Jun 30, 2014
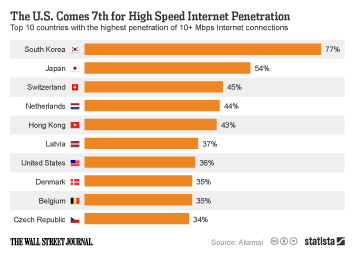
This chart shows the top 10 countries with the highest penetration of 10+ Mbps Internet connections.
More Information
Jun 27, 2014
This chart shows the average number of goals per World Cup match since 1930.
More Information
Jun 27, 2014
This chart shows the percentage of consumers who are willing to pay more for products and services from companies that are committed...
More Information
Jun 26, 2014
This chart breaks down the time spent with digital media in selected content categories in the U.S. in May 2014, by platform.
More Information
Jun 26, 2014
This chart shows cumulative installed solar photovoltaics capacity in leading countries.
More Information
Jun 25, 2014
This chart shows households with education debts in the United States
More Information
Jun 25, 2014
This chart shows reasons why shoppers use a computer as opposed to a mobile device.
More Information
Jun 23, 2014
This chart illustrates how interactions with branded content on Facebook correlate with reach.
More Information
Jun 23, 2014
This chart shows U.S. military drone crashes by year.
More Information
Jun 20, 2014
This chart shows major refugee-hosting countries at the end of 2013.
More Information
Jun 20, 2014
This chart shows how people plan to use their smartphones to follow the world cup.
More Information
Jun 20, 2014
This chart shows the total investments made in Brazil to host the 2014 World Cup.
More Information
Jun 19, 2014
This chart shows the percentage of the population agreeing they feel close to their neighbours in selected E.U. countries.
More Information
Jun 18, 2014
This chart shows how much Amazon Prime members spend on Amazon.com compared to regular customers.
More Information
Jun 18, 2014
This chart shows the number of World Cup tickets sold to fans from the following countries.
More Information
Jun 17, 2014
This chart shows the average number of interactions per Facebook post for the most engaging global brands on the social network.
More Information
Jun 17, 2014
This chart shows the market value of national team players at the 2014 FIFA World Cup.
More Information
Jun 16, 2014
This chart shows the percentage of online consumers in selected countries who have paid for online news in the past.
More Information
Jun 16, 2014
This chart shows the level of interest in soccer in selected countries in 2014
More Information
Jun 16, 2014
This chart shows combined world-wide sales of consoles and hand-helds ending in March of year shown.
More Information
150
/
161
Contact
Get in touch with us. We are happy to help.
Do you still have questions?
Feel free to contact us anytime using our
contact form
or visit our
FAQ page
.
Your contact to the Infographics Newsroom
Felix Richter
Data Journalist
felix.richter@statista.com
+49 (40) 284 841 557