Skip to main content
Consumer Goods & FMCG
E-Commerce
Economy & Politics
Energy & Environment
Health, Pharma & Medtech
Internet
Media
Technology & Telecommunications
Transportation & Logistics
Travel, Tourism & Hospitality
View all industries
Global data volume growth
Global AI market size
Number of generative AI users worldwide
Global inflation rate
Retail e-commerce sales worldwide
Largest economies worldwide
Biggest social media platforms by users
Global EV market share by manufacturer
International tourist arrivals by world region
Global annual CO₂ emissions
Browse recent statistics
Artificial intelligence (AI) worldwide
TikTok
Nvidia
E-commerce worldwide
Global GDP
Instagram
Apparel market worldwide
Video gaming worldwide
Global renewable energy industry
Influencer marketing worldwide
Browse recent topics
Consumer Trends 2026
Artificial Intelligence: in-depth market analysis
E-commerce challenges
Global economy
TikTok
Luxury goods: in-depth market analysis
Electric vehicles: A global overview
Video gaming worldwide
Travel and tourism trends 2026
Battery recycling worldwide
Browse recent reports
Explore the tool
Explore Classic mode
Advertising & Media
eCommerce
Consumer
Finance
Global Indicators
Health
Industrial
Mobility
Technology
Explore Market Insights
eCommerce Insights
Research AI
Book a demo
All integrations
Developer docs
Explore Statista Connect
Research
Strategy & Consulting
Marketing
Media & PR
Explore AI assistants
Marketing
Research & Development
Strategy
Sales
Find the fact
Tell the story
Win the pitch
Understand the market
Develop your strategy
Academia
Agencies
Consultancies
Consumer goods
Finance
Tech
Research solutions
Strategy consulting
Communication services
Explore Statista+
Statista R
Statista Healthcare
About Statista
First steps & help center
Webinar & training hub
Success stories
Individuals & Small Teams
Businesses & Enterprises
Academia & Government
English
Deutsch
Daily Data
Global stories vividly visualized
Jun 13, 2014
The chart below shows the results of a survey among Brazilians regarding the situation in their country prior to hosting the World...
More Information
Jun 13, 2014
This chart shows the percentage of time spent viewing by source in the U.S. in March 2014.
More Information
Jun 13, 2014
This chart shows the annual earnings among 2014 World Cup managers.
More Information
Jun 12, 2014
This chart illustrates the increase in consumer IP traffic from 2013 to 2018.
More Information
Jun 12, 2014
This chart shows the average temperature at kickoff of 2014 World Cup group matches.
More Information
Jun 11, 2014
This chart shows video game console sales of Sony, Nintendo and Microsoft.
More Information
Jun 5, 2014
This chart shows the most popular FIFA World Cup players on Twitter.
More Information
Jun 4, 2014
This chart shows the TV series with the biggest average reach on Twitter in the past TV season. On average, more than 6 million Twitter...
More Information
Jun 4, 2014
This chart shows the estimated growth of smartphone subscriptions between 2013 and 2019, broken down by region.
More Information
Jun 3, 2014
This chart shows how accepting people in different parts of the world are of sharing communities.
More Information
Jun 2, 2014
The Environmental Protection Agency will reportedly propose new CO2 emission targets for U.S. power plants on June 2, 2014. Our chart...
More Information
Jun 1, 2014
This chart illustrates the difference in average selling prices of iOS and Android smartphones.
More Information
May 31, 2014
This chart shows the 12 networks with the most nominations at the 2014 Emmy Awards.
More Information
May 30, 2014
This chart shows estimated quarterly billings per user of Apple's iTunes and App Store.
More Information
May 28, 2014
This chart shows the Top 8 tablet brands in North America, based on their share of tablet-based web usage in April 2014.
More Information
May 28, 2014
This chart shows drug-induced deaths per million of the population in 2012.
More Information
May 27, 2014
This charts shows an estimated regional breakdown of Twitter's active user base from 2012 to 2018.
More Information
May 27, 2014
This chart shows the annual profits of forced labor per region.
More Information
May 26, 2014
This infographic illustrates key facts about the U.S. pharmaceutical industry.
More Information
May 26, 2014
This chart shows the performance of eurosceptic parties in the 2014 European elections.
More Information
May 23, 2014
This chart shows which social platforms are used by marketers. It also shows how the use of social networks in marketing differs depending...
More Information
May 23, 2014
This chart shows console power consumption in the most common operating modes.
More Information
May 21, 2014
This chart shows the estimated brand value of the world's most valuable brands in 2014.
More Information
May 21, 2014
This chart shows the average minutes per day spent with online activities in the U.S. in 2013.
More Information
May 20, 2014
This chart shows a breakdown of global smartphone shipments in the first quarter of 2014 by screen size.
More Information
May 20, 2014
This chart shows the most popular cities to take selfies in. According to an analysis of millions of social media posts by personalized...
More Information
May 19, 2014
This chart shows the top U.S. states by the number of permitted breweries in 2013.
More Information
May 19, 2014
This chart shows U.S. patent-infringement suits filed against the following companies in 2013.
More Information
May 16, 2014
This chart shows the 10 countries with the highest number of people newly displaced because of violence or conflict in 2013.
More Information
May 16, 2014
This chart illustrates how the Netflix connection speeds of Comcast subscribers have improved dramatically after the two companies...
More Information
May 15, 2014
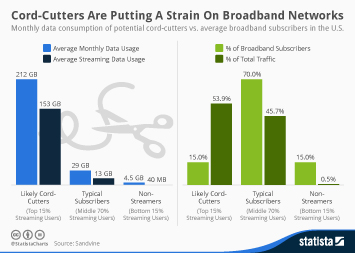
This chart compares the monthly data consumption of potential cord-cutters with that of average broadband subscribers in the United...
More Information
May 15, 2014
This chart shows Bulgarians and Romanians working in the UK.
More Information
May 14, 2014
This chart shows which applications account for the most mobile data traffic in North America
More Information
May 14, 2014
This chart shows total alcohol conumption per capita in litres of pure alcohol.
More Information
May 14, 2014
This chart shows Nintendo's home video game console sales since 1998.
More Information
May 13, 2014
This chart ranks the largest multichannel providers in the United States based on the number of video subscribers in Q1 2014.
More Information
May 13, 2014
This chart shows the proportion of seats held by women in national parliaments in 2013.
More Information
May 12, 2014
This chart shows how the maternal mortality ratio in the United States has changed over the past 23 years.
More Information
May 11, 2014
This chart shows the number of channels viewed by the average U.S. household.
More Information
May 9, 2014
This chart shows how many people in the world have access to clean drinking water and how many still haven't despite all progress....
More Information
May 8, 2014
This chart ranks the preferred headphone brands by American teens.
More Information
May 8, 2014
This chart shows how selected public Internet companies have fared on the first day early investors and employees could sell their...
More Information
May 8, 2014
This chart shows the results of a poll on whether Ukraine should remain united or allow regions to secede.
More Information
May 7, 2014
This chart shows where in-store shoppers prefer to get assistance.
More Information
May 7, 2014
This chart shows the the 10 largest online retailers in the United States, based on online retail sales in 2013.
More Information
May 7, 2014
This chart shows C02 emissions in the E.U. from new cars by fuel type.
More Information
May 6, 2014
This chart shows the reach of social networks among Americans aged 18 to 29 years.
More Information
May 6, 2014
This chart shows the percentage of U.S. Internet users reading hard copy and electronic books.
More Information
May 5, 2014
This chart shows the number of people killed by animals per year.
More Information
May 5, 2014
This chart shows the 10 most dangerous countries for journalists based on the number of journalists that have been killed between 2004...
More Information
May 5, 2014
This chart illustrates the rapid decline of Nintendo's hardware business.
More Information
May 5, 2014
This chart shows smartphone market share figures for the Chinese market in Q1 2014.
More Information
May 5, 2014
This chart shows how U.S. households have adopted HDTVs over the past 5 years.
More Information
May 1, 2014
This chart ranks the companies that were sued the most for U.S. patent infringements in 2013.
More Information
Apr 30, 2014
This chart shows global tablet shipments by operating system.
More Information
Apr 30, 2014
This chart shows executions involving lethal injection by year and duration in the U.S.
More Information
Apr 30, 2014
This chart shows Twitter's timeline views.
More Information
Apr 29, 2014
This chart illustrates that Twitter's user growth is decelerating rather quickly.
More Information
Apr 29, 2014
This chart shows the percentage of Americans whose activities increased a lot due to mobile technology.
More Information
Apr 29, 2014
This chart shows unsolved murders of journalists by the number of cases from 2004 to 2013.
More Information
Apr 28, 2014
This chart shows different forms of streaming.
More Information
Apr 24, 2014
This chart shows the Facebook's average revenue per user.
More Information
Apr 23, 2014
This charts shows Facebook's revenue growth, broken down by segment.
More Information
Apr 23, 2014
This chart shows the growth of average time spent per day with major media by U.S. adults.
More Information
Apr 23, 2014
This chart shows the share of time spent per day with major media by U.S. adults.
More Information
Apr 22, 2014
This chart shows the percentage of U.S. households ending their cable subscriptions.
More Information
Apr 22, 2014
This chart shows the U.S. newspaper advertising revenue.
More Information
Apr 22, 2014
This chart shows the type of content posted by Facebook brand pages worldwide
More Information
Apr 17, 2014
This chart shows how many Twitter accounts that have been created between 2008 and 2013 were still active in February 2014.
More Information
Apr 17, 2014
This chart shows the average annual pay amongst global sports teams in 2014 (in million U.S. dollars).
More Information
Apr 15, 2014
This chart shows the lobbying expenditure of high-profile tech companies in the United States.
More Information
Apr 14, 2014
This chart shows global PC shipments by vendor.
More Information
Apr 11, 2014
This chart shows the 5 countries with the largest share of the world's extremely poor.
More Information
Apr 11, 2014
This chart shows the year-over-year growth of global PC shipments.
More Information
Apr 11, 2014
This chart shows spending per head of the English population on transport infrastructure by region.
More Information
Apr 11, 2014
This chart shows the top categories in mobile app stores.
More Information
Apr 9, 2014
This chart shows how many user data requests Google received from governemnt agencies in different countries in 2013.
More Information
Apr 9, 2014
This chart shows the percentage of young people who have voted in a political election by European country.
More Information
Apr 9, 2014
This chart shows the global market share of operating systems in March 2014.
More Information
Apr 8, 2014
This chart shows how much screen time recent book-to-TV adaptations are squeezing out per page of the underlying book.
More Information
Apr 8, 2014
This chart breaks down smartphone sales growth in 2012 by screen size and price.
More Information
Apr 7, 2014
This chart shows the percentage of time spent on social networks in the United States, by platform.
More Information
Apr 3, 2014
This chart shows the top 10 recipients of remittances from the United States in 2012.
More Information
Apr 2, 2014
This charts ranks the most popular smartphone apps in the United States in 2013, based on the average number of monthly users.
More Information
Apr 2, 2014
This chart shows the most challenging aspects of finding and retaining talent for start-ups in 2013.
More Information
Apr 1, 2014
This chart shows the percentage of tablet owners in the U.S. who frequently use their devices for the following.
More Information
Apr 1, 2014
This chart ranks the world's largest software vendors in 2013 by revenue generated from software sales.
More Information
Apr 1, 2014
This chart shows European Union labour costs per hour in 2013, whole economy.
More Information
Mar 31, 2014
This chart shows the proportion of time users of social networks spent on mobile devices and desktop PCs.
More Information
Mar 31, 2014
This chart shows Americans' perception of Russia from 1999 to 2014
More Information
151
/
161
Contact
Get in touch with us. We are happy to help.
Do you still have questions?
Feel free to contact us anytime using our
contact form
or visit our
FAQ page
.
Your contact to the Infographics Newsroom
Felix Richter
Data Journalist
felix.richter@statista.com
+49 (40) 284 841 557