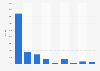
This chart shows LinkedIn’s revenue growth from Q1 2009 to Q1 2012, broken down by segment.
Advertisement
Advertisement

Advertisement


Related Infographics


FAQ
Any more questions?
Get in touch with us quickly and easily.
We are happy to help!
Your contact to the Infographics Newsroom


Statista Content & Design
Need infographics, animated videos, presentations, data research or social media charts?
Advertisement