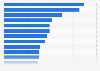
In 2023, the median weekly brand posts on social media app Instagram was 4.7 posts. Overall, sports teams added an average of 18 posts weekly to the social network, while media brands generated an average of 12.2 posts. Additionally, retail brands posted on average 5.7 times per week, whilst fashion brands posted 6.1 times per week.
Average number of weekly brand posts on Instagram in 2023, by vertical
According to the source: "we provide a representative sample of organic and paid posts from national and international companies in each industry by selecting 150 companies at random from each industry in our database of over 200,000 companies. Companies selected had active presences on Facebook, Instagram, and Twitter as of January 2023, and had Facebook fan counts between 25,000 and 1,000,000 and minimum Instagram and Twitter followers of 1,000 as of the same date."
Profit from the additional features of your individual account
Currently, you are using a shared account. To use individual functions (e.g., mark statistics as favourites, set
statistic alerts) please log in with your personal account.
If you are an admin, please authenticate by logging in again.
Learn more about how Statista can support your business.
Rival IQ. (February 28, 2024). Average number of weekly brand posts on Instagram in 2023, by vertical [Graph]. In Statista. Retrieved October 06, 2024, from https://www.statista.com/statistics/873935/daily-instagram-brand-posts-by-vertical/
Rival IQ. "Average number of weekly brand posts on Instagram in 2023, by vertical." Chart. February 28, 2024. Statista. Accessed October 06, 2024. https://www.statista.com/statistics/873935/daily-instagram-brand-posts-by-vertical/
Rival IQ. (2024). Average number of weekly brand posts on Instagram in 2023, by vertical. Statista. Statista Inc.. Accessed: October 06, 2024. https://www.statista.com/statistics/873935/daily-instagram-brand-posts-by-vertical/
Rival IQ. "Average Number of Weekly Brand Posts on Instagram in 2023, by Vertical." Statista, Statista Inc., 28 Feb 2024, https://www.statista.com/statistics/873935/daily-instagram-brand-posts-by-vertical/
Rival IQ, Average number of weekly brand posts on Instagram in 2023, by vertical Statista, https://www.statista.com/statistics/873935/daily-instagram-brand-posts-by-vertical/ (last visited October 06, 2024)
Average number of weekly brand posts on Instagram in 2023, by vertical [Graph], Rival IQ, February 28, 2024. [Online]. Available: https://www.statista.com/statistics/873935/daily-instagram-brand-posts-by-vertical/