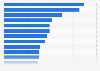
This statistic presents the average number of monthly video posts by brands on Instagram as of July 2017, sorted by profile size. As of the last measured month, brands with over 10 million fans posted an average of 21 video posts to the social network every month.
Average number of monthly video posts by brands to Instagram as of July 2017, by profile size
Profit from the additional features of your individual account
Currently, you are using a shared account. To use individual functions (e.g., mark statistics as favourites, set
statistic alerts) please log in with your personal account.
If you are an admin, please authenticate by logging in again.
Learn more about how Statista can support your business.
Quintly. (August 29, 2017). Average number of monthly video posts by brands to Instagram as of July 2017, by profile size [Graph]. In Statista. Retrieved October 22, 2024, from https://www.statista.com/statistics/691693/instagram-monthly-brand-video-posts-size/
Quintly. "Average number of monthly video posts by brands to Instagram as of July 2017, by profile size." Chart. August 29, 2017. Statista. Accessed October 22, 2024. https://www.statista.com/statistics/691693/instagram-monthly-brand-video-posts-size/
Quintly. (2017). Average number of monthly video posts by brands to Instagram as of July 2017, by profile size. Statista. Statista Inc.. Accessed: October 22, 2024. https://www.statista.com/statistics/691693/instagram-monthly-brand-video-posts-size/
Quintly. "Average Number of Monthly Video Posts by Brands to Instagram as of July 2017, by Profile Size." Statista, Statista Inc., 29 Aug 2017, https://www.statista.com/statistics/691693/instagram-monthly-brand-video-posts-size/
Quintly, Average number of monthly video posts by brands to Instagram as of July 2017, by profile size Statista, https://www.statista.com/statistics/691693/instagram-monthly-brand-video-posts-size/ (last visited October 22, 2024)
Average number of monthly video posts by brands to Instagram as of July 2017, by profile size [Graph], Quintly, August 29, 2017. [Online]. Available: https://www.statista.com/statistics/691693/instagram-monthly-brand-video-posts-size/