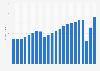
The occupancy rate of hotels in the United States reached 62.7 percent in 2022. This shows growth over the previous two years which were impacted by the coronavirus (COVID-19) pandemic.
What is occupancy rate?
Occupancy rate is a key performance indicator of the hospitality industry. It is calculated by the number of occupied rooms divided by the number of available rooms that are available in a hotel. Other useful KPI’s that are used in the lodging industry are the average daily rate (ADR) and revenue per available room (RevPAR).
Coronavirus impact on the U.S. hotel industry
The COVID-19 pandemic caused unprecedented challenges to the hotel industry across the globe. In the United States, this can be seen in the significant decreases in the industry’s key performance metrics. For one, the occupancy rate of hotels in the U.S. reflected its lowest figures since the 2008 global recession. Consequently, the average daily rate (ADR) and revenue per available room also fell dramatically in 2020.
Occupancy rate of the hotel industry in the United States from 2001 to 2022
Profit from the additional features of your individual account
Currently, you are using a shared account. To use individual functions (e.g., mark statistics as favourites, set
statistic alerts) please log in with your personal account.
If you are an admin, please authenticate by logging in again.
Learn more about how Statista can support your business.
Hospitality Net. (January 21, 2023). Occupancy rate of the hotel industry in the United States from 2001 to 2022 [Graph]. In Statista. Retrieved November 01, 2024, from https://www.statista.com/statistics/200161/us-annual-accomodation-and-lodging-occupancy-rate/
Hospitality Net. "Occupancy rate of the hotel industry in the United States from 2001 to 2022." Chart. January 21, 2023. Statista. Accessed November 01, 2024. https://www.statista.com/statistics/200161/us-annual-accomodation-and-lodging-occupancy-rate/
Hospitality Net. (2023). Occupancy rate of the hotel industry in the United States from 2001 to 2022. Statista. Statista Inc.. Accessed: November 01, 2024. https://www.statista.com/statistics/200161/us-annual-accomodation-and-lodging-occupancy-rate/
Hospitality Net. "Occupancy Rate of The Hotel Industry in The United States from 2001 to 2022." Statista, Statista Inc., 21 Jan 2023, https://www.statista.com/statistics/200161/us-annual-accomodation-and-lodging-occupancy-rate/
Hospitality Net, Occupancy rate of the hotel industry in the United States from 2001 to 2022 Statista, https://www.statista.com/statistics/200161/us-annual-accomodation-and-lodging-occupancy-rate/ (last visited November 01, 2024)
Occupancy rate of the hotel industry in the United States from 2001 to 2022 [Graph], Hospitality Net, January 21, 2023. [Online]. Available: https://www.statista.com/statistics/200161/us-annual-accomodation-and-lodging-occupancy-rate/