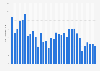
The statistic provides information on the average number of TV viewers for regular season Major League Soccer (MLS) games in the United States from 2012 to 2021. During the 2021 regular season, an average of 285 thousand viewers tuned into each game, marking an 11 percent increase on the previous year.
Average TV viewers of Major League Soccer regular season games in the United States from 2012 to 2021 (in 1,000s)
Basic Account
Get to know the platform
You only have access to basic statistics.
This statistic is not included in your account.
Single Account
The ideal entry-level account for individual users
- Instant access to 1m statistics
- Download in XLS, PDF & PNG format
- Detailed references
$59 $39 / Month *
in the first 12 months
Corporate Account
Full access
Corporate solution including all features.
* Prices do not include sales tax.
Further Content: You might find this interesting as well
Statistics
- Most viewed Hexagonal soccer games in the U.S. 2017
- Distribution of soccer TV viewers in the U.S 2009-2013, by ethnicity
- Share of sports TV time spent watching soccer worldwide 2013, by country
- Most-watched commercial sport programs in the United Kingdom (UK) 2020
- Television viewership of the MLS regular season in 2012 and 2013
- Age breakdown of Nascar TV audience in the U.S. during 2013 Sprint Cup Series
- Distribution of NBA regular season TV audience 2014, by ethnicity
- Women's World Cup viewership habits in the U.S. 2019, by ethnicity
- Average TV viewership in the U.S. of selected soccer games 2016
- Age breakdown of NBA TV audience during 2013 regular season
- Women's World Cup viewership habits in the U.S. 2019, by gender
- Women's World Cup viewership habits in the U.S. 2019
- Women's World Cup viewership habits in the U.S. 2019, by age
- Women's World Cup viewership in the U.S. 2015
- Gender breakdown of NBA television audience in 2013 regular season
- 2016 Democratic National Convention: number of U.S. viewers, by age
- Leading sports watched on TV or online by African American LGBTs in the U.S. 2014
- Most important sports events in Poland 2020
- Hourly volume of sports programs on free television in France 2018, by channel
Website (the18.com). (March 18, 2022). Average TV viewers of Major League Soccer regular season games in the United States from 2012 to 2021 (in 1,000s) [Graph]. In Statista. Retrieved August 07, 2022, from https://www.statista.com/statistics/308161/number-mls-tv-viewers-usa/
Website (the18.com). "Average TV viewers of Major League Soccer regular season games in the United States from 2012 to 2021 (in 1,000s)." Chart. March 18, 2022. Statista. Accessed August 07, 2022. https://www.statista.com/statistics/308161/number-mls-tv-viewers-usa/
Website (the18.com). (2022). Average TV viewers of Major League Soccer regular season games in the United States from 2012 to 2021 (in 1,000s). Statista. Statista Inc.. Accessed: August 07, 2022. https://www.statista.com/statistics/308161/number-mls-tv-viewers-usa/
Website (the18.com). "Average Tv Viewers of Major League Soccer Regular Season Games in The United States from 2012 to 2021 (in 1,000s)." Statista, Statista Inc., 18 Mar 2022, https://www.statista.com/statistics/308161/number-mls-tv-viewers-usa/
Website (the18.com), Average TV viewers of Major League Soccer regular season games in the United States from 2012 to 2021 (in 1,000s) Statista, https://www.statista.com/statistics/308161/number-mls-tv-viewers-usa/ (last visited August 07, 2022)