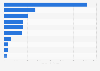
Sales of the H&M Group worldwide 2006-2023
This statistic depicts the sales of the H&M Group worldwide from 2006 to 2023. In the fiscal year 2023, global net sales of the H&M Group amounted to about 236 billion Swedish kronor.
H&M
H&M offers a broad and varied range of fashion including collections for women, men, teenagers and children. The range also includes sportswear, underwear, shoes, accessories and cosmetics, as well as home textiles and decorations from H&M Home.
Germany is H&M's largest market. In 2023, over 35 billion Swedish kronor were generated from that country alone. The company operates roughly 4,370 stores worldwide and employs over 100,000 people. H&M dropped out of the top ten most valuable apparel brands in the world as of 2023.
H&M aims to be a more sustainable choice for today’s increasingly aware customers. To this end, H&M’s investments in social improvements and reduced environmental impact extend throughout the product life cycle – from responsible use of natural resources to ensuring good working conditions at suppliers’ factories. Sustainability work is thoroughly integrated into the business, not only because it is an investment in the customer offering,but also because it is vital to the group’s long-term growth and development. However, there have been questions raised as to how effective and trustworthy H&M's sustainability practices really are.