
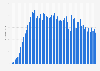


Samsung semiconductor market revenue worldwide 2007-2023
In 2023, Samsung's semiconductor revenue stood at 39.9 billion U.S. dollars, a reduction from the 63.8 billion U.S. dollars in revenue that the company recorded in 2022. Samsung suffered as a result of the memory semiconductor market experiencing one of its worst declines in history.


