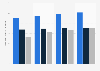
This statistic presents the frequency of mobile Tumblr access in the United States. As of the second quarter of 2017, it was found that 26 percent of U.S. mobile users accessed the social network several times a week.
Frequency of Tumblr use among mobile users in the United States as of 2nd quarter 2017
Basic Account
Get to know the platform
You only have access to basic statistics.
This statistic is not included in your account.
Starter Account
The ideal entry-level account for individual users
- Instant access to 1m statistics
- Download in XLS, PDF & PNG format
- Detailed references
$69 USD $49 USD / Month *
in the first 12 months
Professional Account
Full access
Business Solutions including all features.
* Prices do not include sales tax.
Statistics on Mobile social media usage in the United States
Overview
5
- Basic Statistic Media usage in an online minute 2022
- Basic Statistic Global mobile social penetration rate 2019, by region
- Basic Statistic U.S. social media mobile visits share 2019
- Basic Statistic Mobile share of U.S. social media visits 2017-2019
- Premium Statistic Daily U.S. adult user time spent on digital media 2016-2020
Market leaders
8
- Premium Statistic Reach of most popular U.S. smartphone apps 2023
- Basic Statistic Leading app categories in the United States Q3 2020, by reach
- Premium Statistic U.S. mobile social app user engagement growth 2018
- Premium Statistic Leading Android apps in the U.S. 2022, by downloads
- Premium Statistic Leading iPhone social media apps in the U.S. 2022, by downloads
- Premium Statistic Leading iPhone social media apps in the U.S. 2022, by revenue
- Basic Statistic Most popular social media apps in the U.S. 2019, by audience
- Basic Statistic Most popular social media apps in the U.S. 2019, by reach
Mobile messaging
8
- Basic Statistic Leading mobile messengers in the U.S. 2019, by users
- Premium Statistic Leading mobile messengers in the U.S. 2019, by reach
- Premium Statistic Leading mobile messengers in the U.S. 2019, by monthly usage
- Premium Statistic Leading mobile messengers in the U.S. 2019, by monthly sessions
- Premium Statistic Leading mobile messengers in the U.S. 2019, by session duration
- Premium Statistic U.S. & UK top dark social channels for content and information sharing 2019
- Basic Statistic Top mobile messaging features by U.S. adults 2018
- Basic Statistic Number of messaging services used by U.S. adults in the past month 2018
Activities
8
- Basic Statistic U.S. social media activities 2019, by platform
- Basic Statistic Daily engagement rate of U.S. mobile social users 2020
- Basic Statistic Most popular smartphone activities in the United States 2018, by frequency
- Basic Statistic Teen perspectives on positive effects of social media in the U.S. 2018
- Premium Statistic Second screen activities of U.S. users while watching TV 2017
- Premium Statistic Frequency of U.S. smartphone social usage while watching TV 2019
- Premium Statistic Gen Z social commerce usage type in the U.S. & UK 2022, by gender
- Premium Statistic U.S. cyber bullying environments 2021
Instagram
8
- Premium Statistic Instagram: number of users in the United States 2020-2023
- Basic Statistic Instagram usage reach in the United States 2021, by gender
- Basic Statistic Instagram usage reach in the United States 2021, by age group
- Basic Statistic Instagram usage reach in the United States 2019, by education
- Premium Statistic Leading U.S. brands on Instagram 2020, by user engagement
- Premium Statistic Fastest-growing Instagram influencers in the U.S. 2020
- Premium Statistic Most popular food influencers on Instagram in the U.S. 2020
- Premium Statistic Most popular travel influencers on Instagram in the U.S. 2020
Snapchat
5
- Premium Statistic Snapchat MAU user ratio in the U.S. 2021, by gender
- Premium Statistic Snapchat MAU user ratio in the U.S. 2021, by age group
- Premium Statistic Snapchat MAU user ratio in the U.S. 2021, by age group & gender
- Premium Statistic Snapchat user ratio in the U.S. 2021, by frequency
- Premium Statistic Rate of Snapchat user activity in the U.S. 2021
Further related statistics
15
- Share of U.S. internet users who use Tumblr 2015, by education level
- Tumblr usage purposes in Finland 2019
- Tumblr penetration in selected EMEA countries as of 1st quarter 2013
- Tumblr penetration in selected APAC countries as of 1st quarter 2013
- Tumblr penetration in selected American countries as of 1st quarter 2013
- Web traffic referrers to Tumblr.com 2022
- Tumblr usage in Finland 2019, by device
- Tumblr: distribution of U.S. users 2016, by age
- Tumblr usage frequency in Finland 2020
- Tumblr usage purposes in Norway 2019
- Tumblr usage frequency in Denmark 2020
- Tumblr penetration in the Netherlands 2016, by province
- U.S. internet user sentiment on Yahoo's acquisition of Tumblr 2013
- iOS mobile app advertisers on Tumblr 2015, by category
- Age structure of Tumblr visitors in Germany 2013
Further Content: You might find this interesting as well
Statistics
- Share of U.S. internet users who use Tumblr 2015, by education level
- Tumblr usage purposes in Finland 2019
- Tumblr penetration in selected EMEA countries as of 1st quarter 2013
- Tumblr penetration in selected APAC countries as of 1st quarter 2013
- Tumblr penetration in selected American countries as of 1st quarter 2013
- Web traffic referrers to Tumblr.com 2022
- Tumblr usage in Finland 2019, by device
- Tumblr: distribution of U.S. users 2016, by age
- Tumblr usage frequency in Finland 2020
- Tumblr usage purposes in Norway 2019
- Tumblr usage frequency in Denmark 2020
- Tumblr penetration in the Netherlands 2016, by province
- U.S. internet user sentiment on Yahoo's acquisition of Tumblr 2013
- iOS mobile app advertisers on Tumblr 2015, by category
- Age structure of Tumblr visitors in Germany 2013
AudienceProject. (August 24, 2017). Frequency of Tumblr use among mobile users in the United States as of 2nd quarter 2017 [Graph]. In Statista. Retrieved May 30, 2023, from https://www.statista.com/statistics/749847/tumblr-mobile-use-frequency-usa/
AudienceProject. "Frequency of Tumblr use among mobile users in the United States as of 2nd quarter 2017." Chart. August 24, 2017. Statista. Accessed May 30, 2023. https://www.statista.com/statistics/749847/tumblr-mobile-use-frequency-usa/
AudienceProject. (2017). Frequency of Tumblr use among mobile users in the United States as of 2nd quarter 2017. Statista. Statista Inc.. Accessed: May 30, 2023. https://www.statista.com/statistics/749847/tumblr-mobile-use-frequency-usa/
AudienceProject. "Frequency of Tumblr Use among Mobile Users in The United States as of 2nd Quarter 2017." Statista, Statista Inc., 24 Aug 2017, https://www.statista.com/statistics/749847/tumblr-mobile-use-frequency-usa/
AudienceProject, Frequency of Tumblr use among mobile users in the United States as of 2nd quarter 2017 Statista, https://www.statista.com/statistics/749847/tumblr-mobile-use-frequency-usa/ (last visited May 30, 2023)
Frequency of Tumblr use among mobile users in the United States as of 2nd quarter 2017 [Graph], AudienceProject, August 24, 2017. [Online]. Available: https://www.statista.com/statistics/749847/tumblr-mobile-use-frequency-usa/